
For investors looking for a structured method to find market leaders with high growth, the CAN SLIM system, created by William O'Neil, is a foundational strategy. It merges detailed fundamental study with important technical signs to find stocks with solid earnings momentum, support from large institutions, and better price performance, preferably when the overall market is positive. This organized method tries to identify the major advances of companies starting periods of substantial expansion.
A recent filter using this system has identified Taiwan Semiconductor Manufacturing Co., Ltd. (NYSE:TSM) as a possible choice. As the top dedicated semiconductor foundry globally, TSM's results are frequently seen as an indicator for the wider technology industry. We will look at how the company fits the main parts of the CAN SLIM system.
Looking at the Fundamental "C-A" Requirements
The "C" and "A" in CAN SLIM center on present and yearly earnings strength, which are important for finding real growth instead of short-term jumps. TSM displays notable strength in these areas, as shown in its fundamental analysis report.
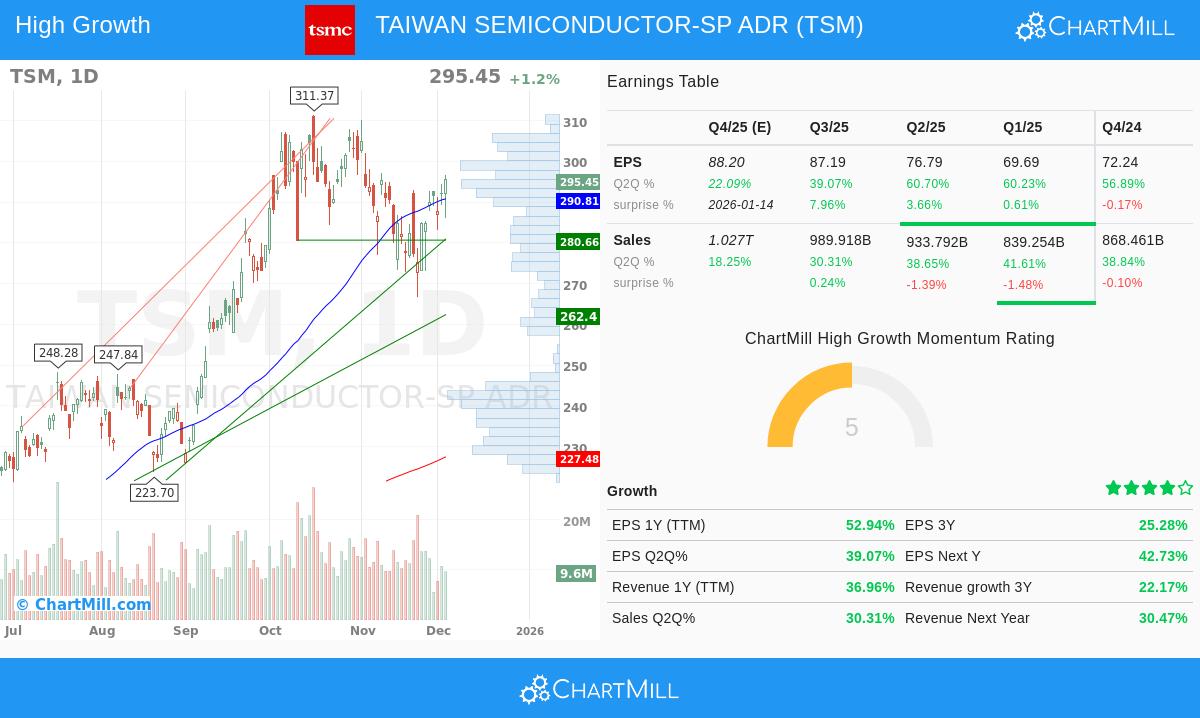
- Present Quarterly Earnings & Sales (C): The system searches for faster growth in the latest quarter. TSM shows quarterly earnings per share (EPS) growth of 39.1% and sales growth of 30.3% versus the same quarter last year, clearly above the common minimum levels of 20-25%. This points to strong short-term business momentum.
- Yearly Earnings Gains (A): To check for durability, CAN SLIM needs a solid history. TSM displays a 3-year EPS compound annual growth rate (CAGR) of 25.3%, meeting the system's high standard for steady yearly increase. Also, its Return on Equity (ROE) of 31.7% is much higher than the minimum 10% needed, showing very efficient use of investor capital.
Reviewing Market and Institutional Factors ("N-S-L-I")
The last part of the name handles market acceptance, supply/demand, and institutional support—elements that help verify a fundamental story is being accepted by the larger market.
- New Offerings, New Highs (N): TSM is a leader in the "new" in technology, as the main producer for the world's most advanced chips. From a chart view, its stock has been trading near the top of its 52-week range, a trait often wanted in CAN SLIM stocks ready for breakout advances.
- Supply, Demand, and Position (S & L): The company holds a solid balance sheet with a low Debt-to-Equity ratio of 0.18, showing financial stability and reasonable debt. Significantly, its Relative Strength (CRS) score of 90.4 means it is performing better than over 90% of the market. This leading position is a key part of the "L" requirement, finding stocks that are market front-runners, not followers.
- Institutional Support (I): While ownership by institutions is necessary, the system favors it not be too high, allowing space for new institutional purchases. TSM's institutional ownership is at 36.3%, a level that indicates notable support exists but there is still plenty of room for more institutional attention.
Chart Condition and Market Setting
A stock's chart pattern and the general market direction ("M") are important for entry timing. According to TSM's technical analysis report, the stock receives a high score of 9 out of 10. The long-term direction is up, and the stock is forming a reasonable consolidation pattern, moving sideways near a price ceiling. This matches the CAN SLIM idea of searching for entries as a stock moves out of a sound consolidation period. Critically, the present market setting, with the S&P 500 in a positive long-term direction, meets the "M" requirement for evaluating new investments.
Summary Rating Overview
In summary, the given reports describe a company that grades well on both fundamental and technical filters:
- Fundamentally (Score: 6/10): TSM displays very good profitability and outstanding growth measures, although its price is high. The financial condition is firm, and the growth prospect stays positive.
- Technically (Score: 9/10): The stock is in a solid upward direction, shows high relative strength against the market, and is consolidating in a way that might come before a new upward move, helped by good average trading volume.
A Choice for More Study
Based on the particular measures from the CAN SLIM filter, Taiwan Semiconductor Manufacturing (TSM) shows a notable profile for investors focused on growth. It displays the strong earnings acceleration and yearly growth the system requires, pairs it with better market position (high relative strength), and works from a state of financial firmness. The chart behavior indicates the market is acknowledging this fundamental story.
For investors wanting to examine other stocks that currently meet similar CAN SLIM-based filters, you can see the complete filtering outcomes through this pre-set CANSLIM stock screener.
Disclaimer: This article is for information only and is not investment guidance, a suggestion, or a bid to buy or sell any security. The CAN SLIM system includes risk, and previous results do not guarantee future outcomes. Investors must do their own complete study and think about their personal financial position and risk comfort before making any investment choices.