
AT&T INC (NYSE:T) has been identified as a potential breakout candidate by our technical screening process. The stock currently exhibits strong technical health and a well-defined consolidation pattern, making it worth a closer look for traders focused on momentum and breakout strategies.
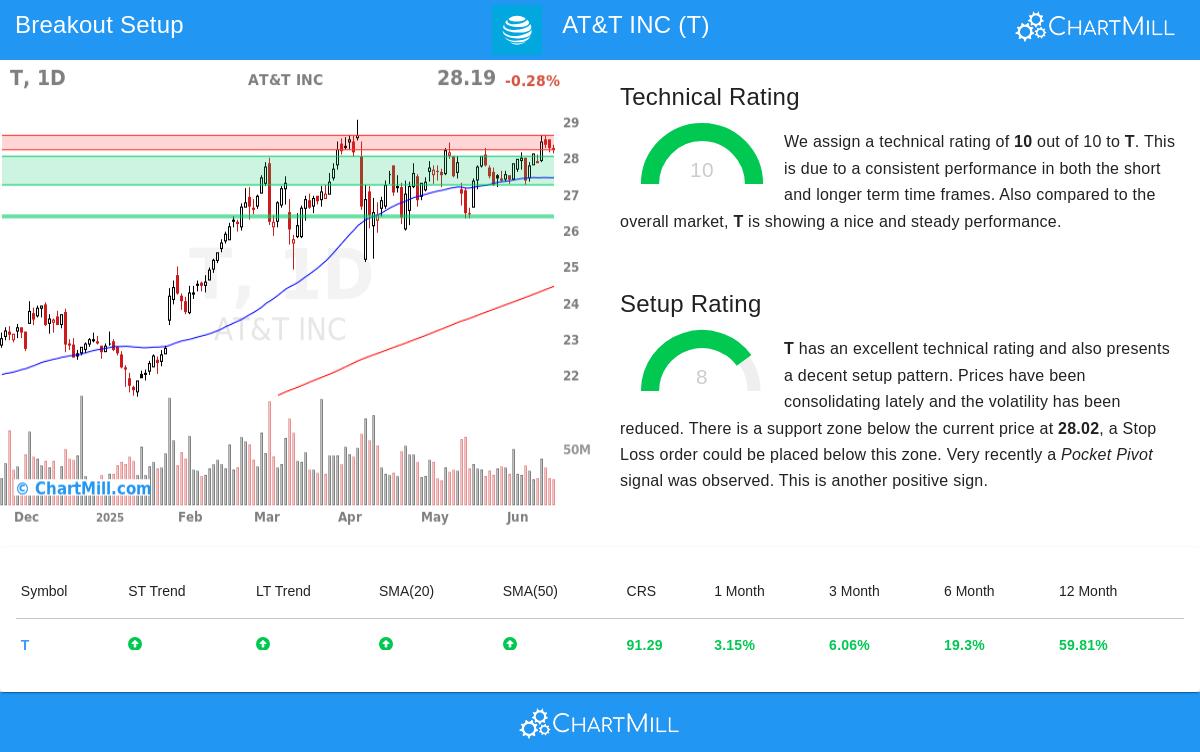
Technical Strength
AT&T holds a perfect Technical Rating of 10, reflecting its strong performance across multiple time frames. Key factors supporting this rating include:
- Positive trends: Both short-term and long-term trends are upward, reinforcing the stock’s momentum.
- Relative strength: T has outperformed 91% of all stocks over the past year, with gains distributed consistently.
- Industry leadership: Within the Diversified Telecommunication Services sector, T ranks ahead of 81% of its peers.
- Price near highs: The stock is trading close to its 52-week high, signaling strength compared to the broader market.
Setup Quality
With a Setup Rating of 8, T presents a favorable consolidation pattern:
- Tight trading range: Over the past month, the stock has moved between $27.12 and $28.61, reducing volatility.
- Support levels: A well-defined support zone sits between $27.23 and $28.02, offering a logical stop-loss area.
- Recent accumulation: A Pocket Pivot signal suggests institutional buying interest.
The technical report suggests a potential breakout above $28.61, with a stop-loss level around $27.21.
For more breakout opportunities, see our Technical Breakout Setups screener.
Disclaimer
This is not investment advice. Always conduct your own analysis before making trading decisions.