
QUALCOMM INC (NASDAQ:QCOM) stands out as a compelling pick for investors seeking growth at a reasonable price (GARP). The company, a leader in wireless technology, meets key criteria from Peter Lynch’s investment strategy, balancing solid growth, profitability, and an attractive valuation.
Growth and Valuation
- EPS Growth: Over the past five years, QCOM has delivered an impressive average annual EPS growth of 23.5%, well above the 15% threshold in Lynch’s strategy.
- PEG Ratio: At 0.59, the PEG ratio (price/earnings relative to growth) signals that the stock is undervalued given its earnings trajectory. A PEG below 1 suggests a favorable risk-reward balance.
Financial Health
- Debt Management: With a Debt/Equity ratio of 0.48, QCOM maintains a conservative capital structure, aligning with Lynch’s preference for companies with manageable debt levels.
- Liquidity: The Current Ratio of 2.73 indicates strong short-term financial stability, ensuring the company can cover its obligations comfortably.
- Profitability: A Return on Equity (ROE) of 39.8% highlights efficient use of shareholder capital, far exceeding the 15% benchmark in Lynch’s framework.
Fundamental Strength
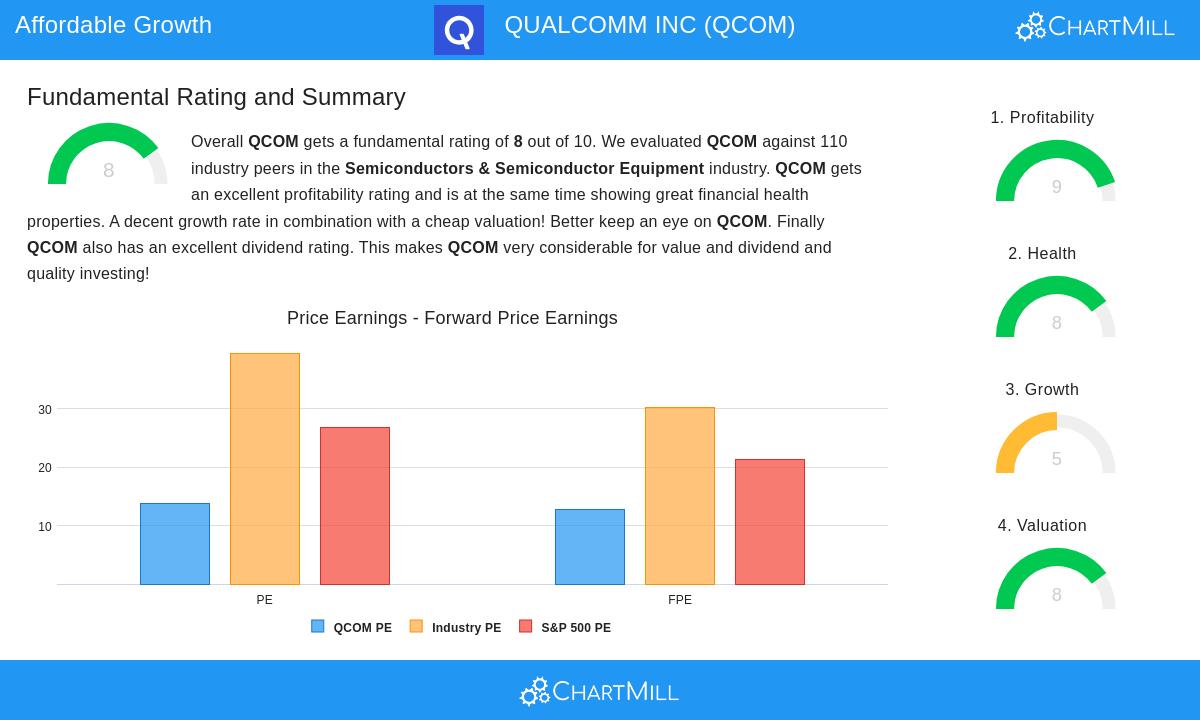
Our fundamental analysis report rates QCOM 8 out of 10, with high marks for profitability, financial health, and valuation. Key takeaways:
- Strong Margins: Operating margin of 27.6% and profit margin of 26.1% place QCOM among the top performers in its industry.
- Dividend Appeal: A 2.3% dividend yield, backed by a sustainable payout ratio, adds income potential for long-term holders.
- Undervalued Metrics: Compared to industry peers, QCOM trades at a discount on key valuation multiples, including P/E and Price/Free Cash Flow.
While future growth is expected to moderate, QCOM’s established market position in 5G and IoT technologies provides a durable growth runway.
For more stocks fitting the GARP approach, explore our Peter Lynch Strategy screener.
Disclaimer
This is not investing advice. The observations here are based on current data, but investors should conduct their own research before making decisions.


