
PILGRIM'S PRIDE CORP (NASDAQ:PPC) was identified as a decent value stock by our stock screener. PPC scores well on profitability, solvency and liquidity. At the same time it seems to be priced very reasonably. We'll explore this a bit deeper below.
A Closer Look at Valuation for PPC
To assess a stock's valuation, ChartMill utilizes a Valuation Rating on a scale of 0 to 10. This comprehensive assessment considers various valuation aspects, comparing price to earnings and cash flows, while factoring in profitability and growth. PPC has achieved a 8 out of 10:
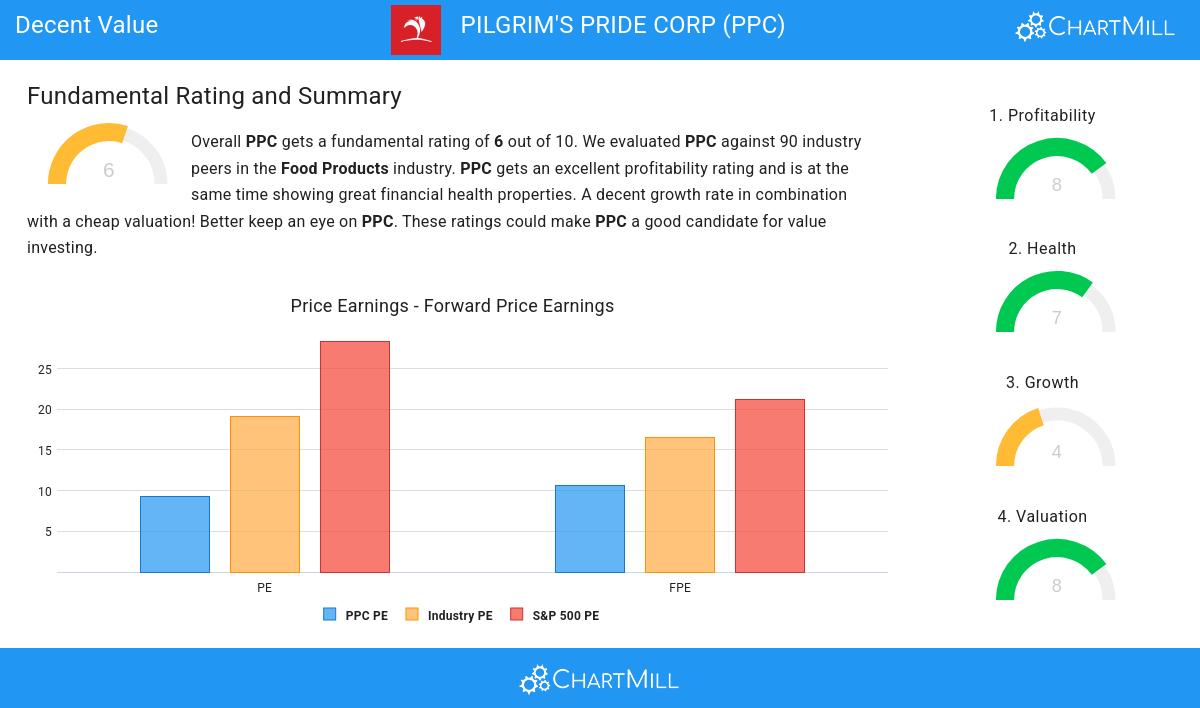
- A Price/Earnings ratio of 9.27 indicates a reasonable valuation of PPC.
- PPC's Price/Earnings ratio is rather cheap when compared to the industry. PPC is cheaper than 91.11% of the companies in the same industry.
- Compared to an average S&P500 Price/Earnings ratio of 28.38, PPC is valued rather cheaply.
- PPC is valuated reasonably with a Price/Forward Earnings ratio of 10.57.
- Based on the Price/Forward Earnings ratio, PPC is valued cheaper than 87.78% of the companies in the same industry.
- PPC's Price/Forward Earnings ratio indicates a rather cheap valuation when compared to the S&P500 average which is at 21.15.
- Based on the Enterprise Value to EBITDA ratio, PPC is valued cheaply inside the industry as 83.33% of the companies are valued more expensively.
- 83.33% of the companies in the same industry are more expensive than PPC, based on the Price/Free Cash Flow ratio.
- The excellent profitability rating of PPC may justify a higher PE ratio.
Looking at the Profitability
ChartMill's Profitability Rating offers a unique perspective on stock analysis, providing scores from 0 to 10. These ratings consider a wide range of profitability metrics and margins, both in comparison to industry peers and on their own merits. For PPC, the assigned 8 is a significant indicator of profitability:
- The Return On Assets of PPC (10.20%) is better than 91.11% of its industry peers.
- PPC's Return On Equity of 25.63% is amongst the best of the industry. PPC outperforms 94.44% of its industry peers.
- PPC's Return On Invested Capital of 16.32% is amongst the best of the industry. PPC outperforms 95.56% of its industry peers.
- The Average Return On Invested Capital over the past 3 years for PPC is above the industry average of 8.83%.
- The 3 year average ROIC (12.54%) for PPC is below the current ROIC(16.32%), indicating increased profibility in the last year.
- Looking at the Profit Margin, with a value of 6.08%, PPC is in the better half of the industry, outperforming 76.67% of the companies in the same industry.
- PPC's Profit Margin has improved in the last couple of years.
- PPC has a better Operating Margin (8.95%) than 71.11% of its industry peers.
- PPC's Operating Margin has improved in the last couple of years.
- PPC's Gross Margin has improved in the last couple of years.
What does the Health looks like for PPC
ChartMill utilizes a Health Rating to assess stocks, scoring them on a scale of 0 to 10. This rating takes into account a variety of liquidity and solvency ratios, both in absolute terms and in comparison to industry peers. PPC has earned a 7 out of 10:
- PPC has an Altman-Z score of 3.99. This indicates that PPC is financially healthy and has little risk of bankruptcy at the moment.
- PPC's Altman-Z score of 3.99 is amongst the best of the industry. PPC outperforms 81.11% of its industry peers.
- The Debt to FCF ratio of PPC is 2.12, which is a good value as it means it would take PPC, 2.12 years of fcf income to pay off all of its debts.
- PPC has a Debt to FCF ratio of 2.12. This is in the better half of the industry: PPC outperforms 77.78% of its industry peers.
- Although PPC does not score too well on debt/equity it has very limited outstanding debt, which is well covered by the FCF. We will not put too much weight on the debt/equity number as it may be because of low equity, which could be a consequence of a share buyback program for instance. This needs to be investigated.
- PPC has a Current Ratio of 2.01. This indicates that PPC is financially healthy and has no problem in meeting its short term obligations.
- PPC has a better Current ratio (2.01) than 61.11% of its industry peers.
- The Quick ratio of PPC (1.31) is better than 72.22% of its industry peers.
Analyzing Growth Metrics
Every stock receives a Growth Rating from ChartMill, ranging from 0 to 10. This rating assesses various growth aspects, including historical and projected EPS and revenue growth. PPC boasts a 4 out of 10:
- The Earnings Per Share has grown by an impressive 220.71% over the past year.
- The Earnings Per Share has been growing by 27.16% on average over the past years. This is a very strong growth
- PPC shows quite a strong growth in Revenue. Measured over the last years, the Revenue has been growing by 9.40% yearly.
Our Decent Value screener lists more Decent Value stocks and is updated daily.
Check the latest full fundamental report of PPC for a complete fundamental analysis.
Disclaimer
This is not investing advice! The article highlights some of the observations at the time of writing, but you should always make your own analysis and invest based on your own insights.