
Consider CAL-MAINE FOODS INC (NASDAQ:CALM) as a top pick for dividend investors, identified by our stock screening tool. CALM shines in terms of profitability, solvency, and liquidity, all while paying a decent dividend. Let's dive deeper into the analysis.
Dividend Examination for CALM
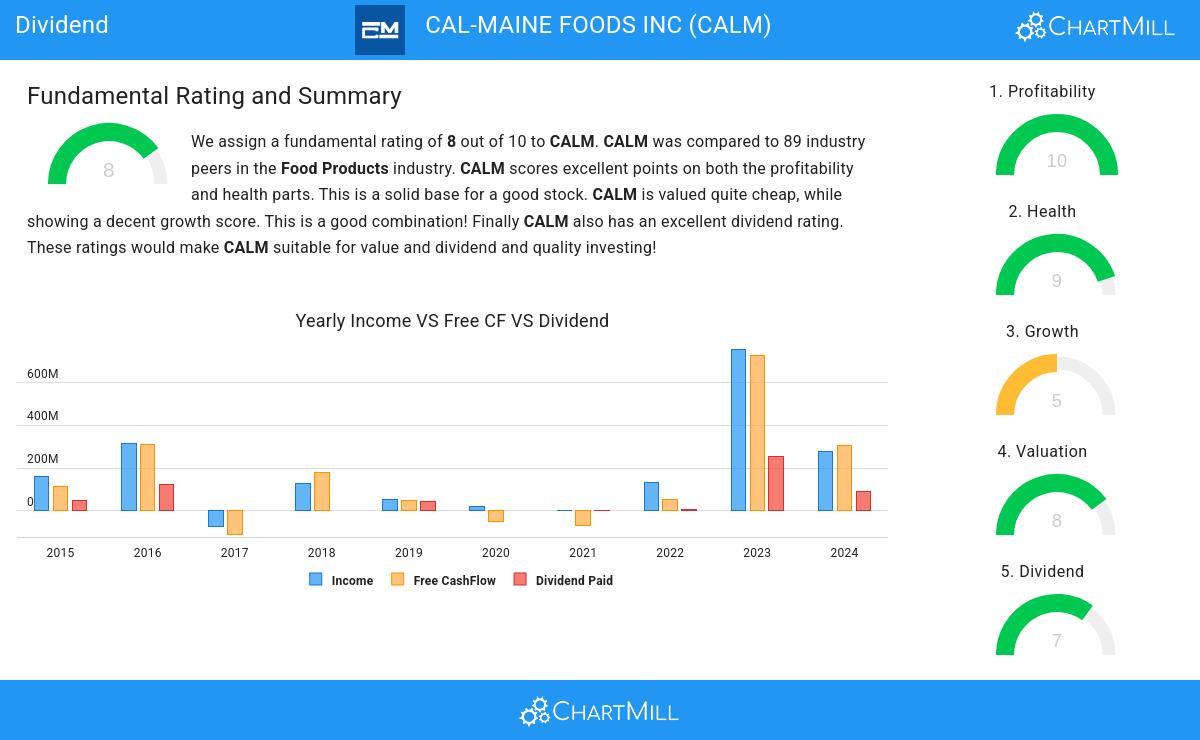
ChartMill employs its own Dividend Rating system for all stocks. This score, on a scale of 0 to 10, is determined by evaluating different dividend factors, such as yield, historical performance, dividend growth, and sustainability. CALM has been assigned a 7 for dividend:
- CALM has a Yearly Dividend Yield of 15.11%, which is a nice return.
- Compared to an average industry Dividend Yield of 4.35, CALM pays a better dividend. On top of this CALM pays more dividend than 100.00% of the companies listed in the same industry.
- CALM's Dividend Yield is rather good when compared to the S&P500 average which is at 2.51.
- On average, the dividend of CALM grows each year by 16.93%, which is quite nice.
- CALM has been paying a dividend for at least 10 years, so it has a reliable track record.
- 21.16% of the earnings are spent on dividend by CALM. This is a low number and sustainable payout ratio.
How We Gauge Health for CALM
ChartMill utilizes a Health Rating to assess stocks, scoring them on a scale of 0 to 10. This rating takes into account a variety of liquidity and solvency ratios, both in absolute terms and in comparison to industry peers. CALM has earned a 9 out of 10:
- An Altman-Z score of 8.03 indicates that CALM is not in any danger for bankruptcy at the moment.
- CALM has a Altman-Z score of 8.03. This is amongst the best in the industry. CALM outperforms 95.51% of its industry peers.
- There is no outstanding debt for CALM. This means it has a Debt/Equity and Debt/FCF ratio of 0 and it is amongst the best of the sector and industry.
- A Current Ratio of 3.86 indicates that CALM has no problem at all paying its short term obligations.
- CALM's Current ratio of 3.86 is amongst the best of the industry. CALM outperforms 91.01% of its industry peers.
- CALM has a Quick Ratio of 3.26. This indicates that CALM is financially healthy and has no problem in meeting its short term obligations.
- CALM has a Quick ratio of 3.26. This is amongst the best in the industry. CALM outperforms 95.51% of its industry peers.
Profitability Analysis for CALM
ChartMill's Profitability Rating offers a unique perspective on stock analysis, providing scores from 0 to 10. These ratings consider a wide range of profitability metrics and margins, both in comparison to industry peers and on their own merits. For CALM, the assigned 10 is a significant indicator of profitability:
- CALM's Return On Assets of 32.15% is amongst the best of the industry. CALM outperforms 98.88% of its industry peers.
- With an excellent Return On Equity value of 41.60%, CALM belongs to the best of the industry, outperforming 97.75% of the companies in the same industry.
- CALM's Return On Invested Capital of 36.48% is amongst the best of the industry. CALM outperforms 98.88% of its industry peers.
- Measured over the past 3 years, the Average Return On Invested Capital for CALM is significantly above the industry average of 8.94%.
- The last Return On Invested Capital (36.48%) for CALM is above the 3 year average (20.77%), which is a sign of increasing profitability.
- Looking at the Profit Margin, with a value of 26.08%, CALM belongs to the top of the industry, outperforming 96.63% of the companies in the same industry.
- CALM's Profit Margin has improved in the last couple of years.
- With an excellent Operating Margin value of 32.33%, CALM belongs to the best of the industry, outperforming 98.88% of the companies in the same industry.
- In the last couple of years the Operating Margin of CALM has grown nicely.
- CALM has a Gross Margin of 39.63%. This is amongst the best in the industry. CALM outperforms 88.76% of its industry peers.
- CALM's Gross Margin has improved in the last couple of years.
Every day, new Best Dividend stocks can be found on ChartMill in our Best Dividend screener.
For an up to date full fundamental analysis you can check the fundamental report of CALM
Keep in mind
This article should in no way be interpreted as advice. The article is based on the observed metrics at the time of writing, but you should always make your own analysis and trade or invest at your own responsibility.