
A methodical process for finding possible trading chances mixes technical condition with accurate entry timing. One technique uses filtering for stocks showing both good technical condition and consolidation shapes that indicate approaching breakouts. This approach concentrates on securities with high technical grades showing existing upward trends, joined with high setup scores showing narrow trading bands that frequently come before notable price changes. By merging these measures, investors can find stocks placed for possible extension of their upward paths.
Technical Condition Evaluation
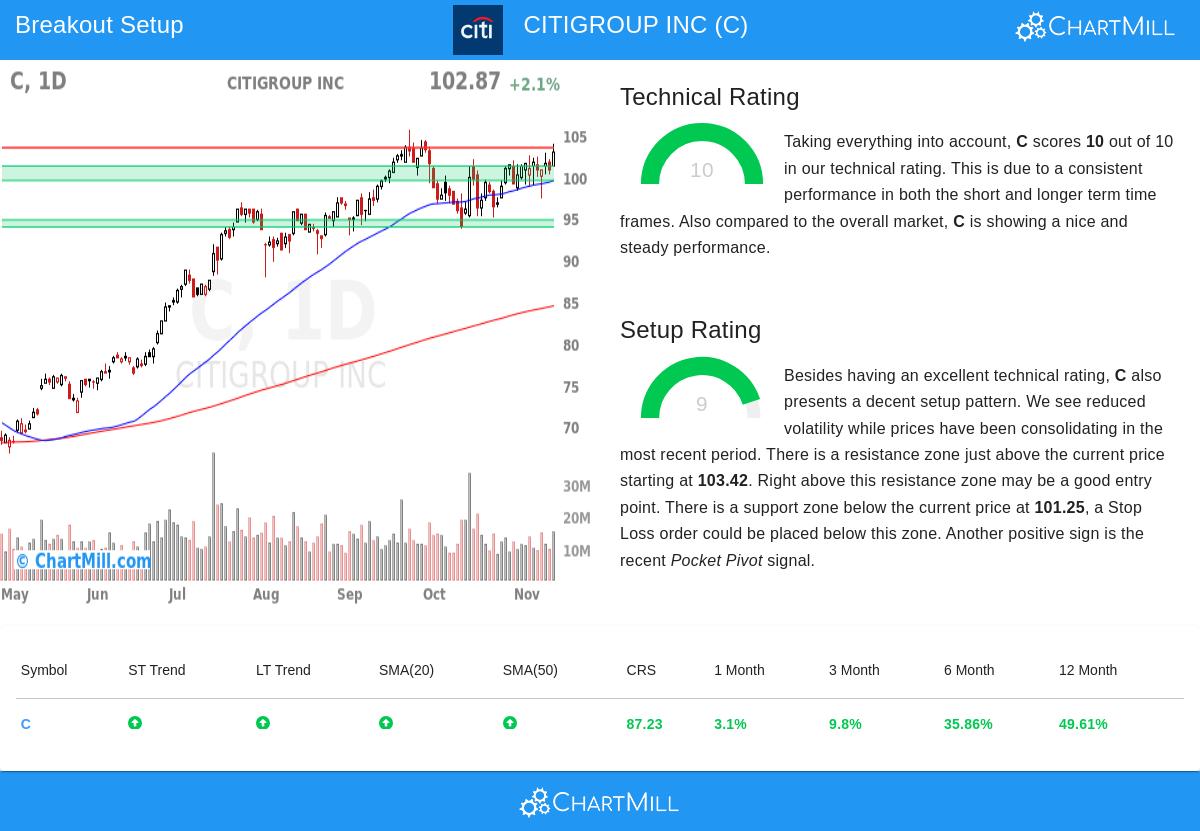
CITIGROUP INC (NYSE:C) shows very good technical condition, getting a complete technical grade of 10 out of 10. This highest-level grade shows strong operation across many time periods and technical measures. The stock's technical base stays firm with both short-period and long-period trends clearly positive, matching the wider market's direction as the S&P500 also keeps positive trends across both time frames.
Main technical advantages contain:
- Regular better operation compared to the market, exceeding 87% of all stocks during the last year
- Industry front position inside the banking field, exceeding 94% of 388 banking stocks
- Trading close to 52-week highs together with the wider market
- All moving averages (20, 50, 100, and 200-day) moving upward
- Large price gains across many periods: 49.6% during 12 months, 35.9% during 6 months, and 9.8% during 3 months
This full technical condition gives the base for possible breakout situations, as stocks with high technical grades usually keep their speed once they come out from consolidation times.
Setup Condition Study
Besides its technical quality, Citigroup shows an interesting setup shape with a setup grade of 9 out of 10. The stock has been consolidating inside a set band between $95.00 and $103.86 during the last month, now trading near the top edge of this band. This consolidation stage has happened with lower instability, making the situation for a possible breakout.
The setup study shows:
- A clear resistance area between $103.42 and $103.49 made by several trendlines
- Large support levels under present prices, beginning at $101.25
- A recent pocket pivot signal showing institutional buying
- Present price location just under resistance with very small distance to possible breakout levels
This high-condition setup allows for exact trade planning with set risk measures. The consolidation shape gives clear reference points for both entry triggers and protective stop losses, necessary parts for handling risk in breakout trading methods.
Trade Plan Factors
The technical study indicates a possible breakout setup with an entry point at $103.50, placed just above the found resistance area. A stop loss at $99.50 would give protection under the closest support level, making a set risk of about 3.86% on the trade. For position size, assigning up to 25% of funds could keep account risk under 1% based on this stop distance.
Important factors for this setup contain:
- The fairly close stop loss distance of 1.49 ATR units might need watchful checking
- The nearness to resistance gives a clear trigger for breakout confirmation
- Several support levels below present prices give possible change chances for different trading time frames
Traders should know that while the automatic setup gives a structure, personal risk comfort and trading method may support changes to both entry and exit measures.
Market Situation and Use
Citigroup's technical picture is notable in the present market setting where financial stocks have shown relative condition. The mix of complete technical grades and high-condition setup shapes makes it worth notice for traders using breakout methods. The stock's large average daily volume of about 13.3 million shares gives enough fluidity for position entry and exit.
For investors curious about finding similar chances, the Technical Breakout Setups screen regularly finds stocks showing both good technical bases and high-condition consolidation shapes. This methodical process can help traders regularly find possible breakout candidates across market situations.
Disclaimer: This study is based on technical measures and automatic shape recognition. It is not investment guidance. Always do your own study, think about your risk comfort, and talk with money experts before making investment choices. Past operation does not promise future outcomes, and trading includes risk of loss.