High Tight Flag Pattern
By Kristoff De Turck - reviewed by Aldwin Keppens
Last update: Dec 4, 2023
Those who trade primarily based on technical analysis and price action have undoubtedly heard of the Bull Flag Pattern. It occurs when a stock in a rising trend experiences a temporary pullback.
The associated price action has similarities to a flag, hence the name. Once the price breaks out above the flag, long positions are taken on the assumption that the existing trend will continue.
Perhaps less known is the "High Tight Bull Flag" pattern. I like to refer to it as a "Bull Flag on steroids". The concept is not new and I first saw the term in Mark Minervini's book, "Think and Trade Like a Champion". He describes this pattern as 'The Power Play'.
“...the power play, also referred to as the high tight flag. This is one of the most important and profitable setups to learn—and one of the most misinterpreted among all the technical patterns. If you get it right, though, it can be one of the most profitable.” - Mark Minervini
Swedish swing trader Kristjan Kullamägi also uses the High Tight Flag as the basic pattern for his breakout setups.
Features of the High Tight Flag pattern
-
The pattern arises from a strong price uptrend/breakout from a sideways price range (stage 1 base for those familiar with Weinstein's stage analysis principle).
-
The price rise is significant (20%, 50%, +100%...), easily identifiable and the time frame in which it occurs is relatively short, sometimes just a couple of days.
-
The surge has a specific catalyst which drives the sudden sharp increase in price, e.g. much better than expected company results.
-
Momentum and volume are thereby (much) higher than normal. In terms of momentum, this manifests itself in strong intraday price rises with hardly any reversals, with the close very near or equal to the highest daily price.
-
The moment the uptrend loses momentum the typical flag pattern emerges. A slight drop in price follows over a period of several days/weeks, which occurs on significantly lower volume and in which volatility decreases substantially (the price range in which the stock moves becomes considerably narrower).
Two Examples
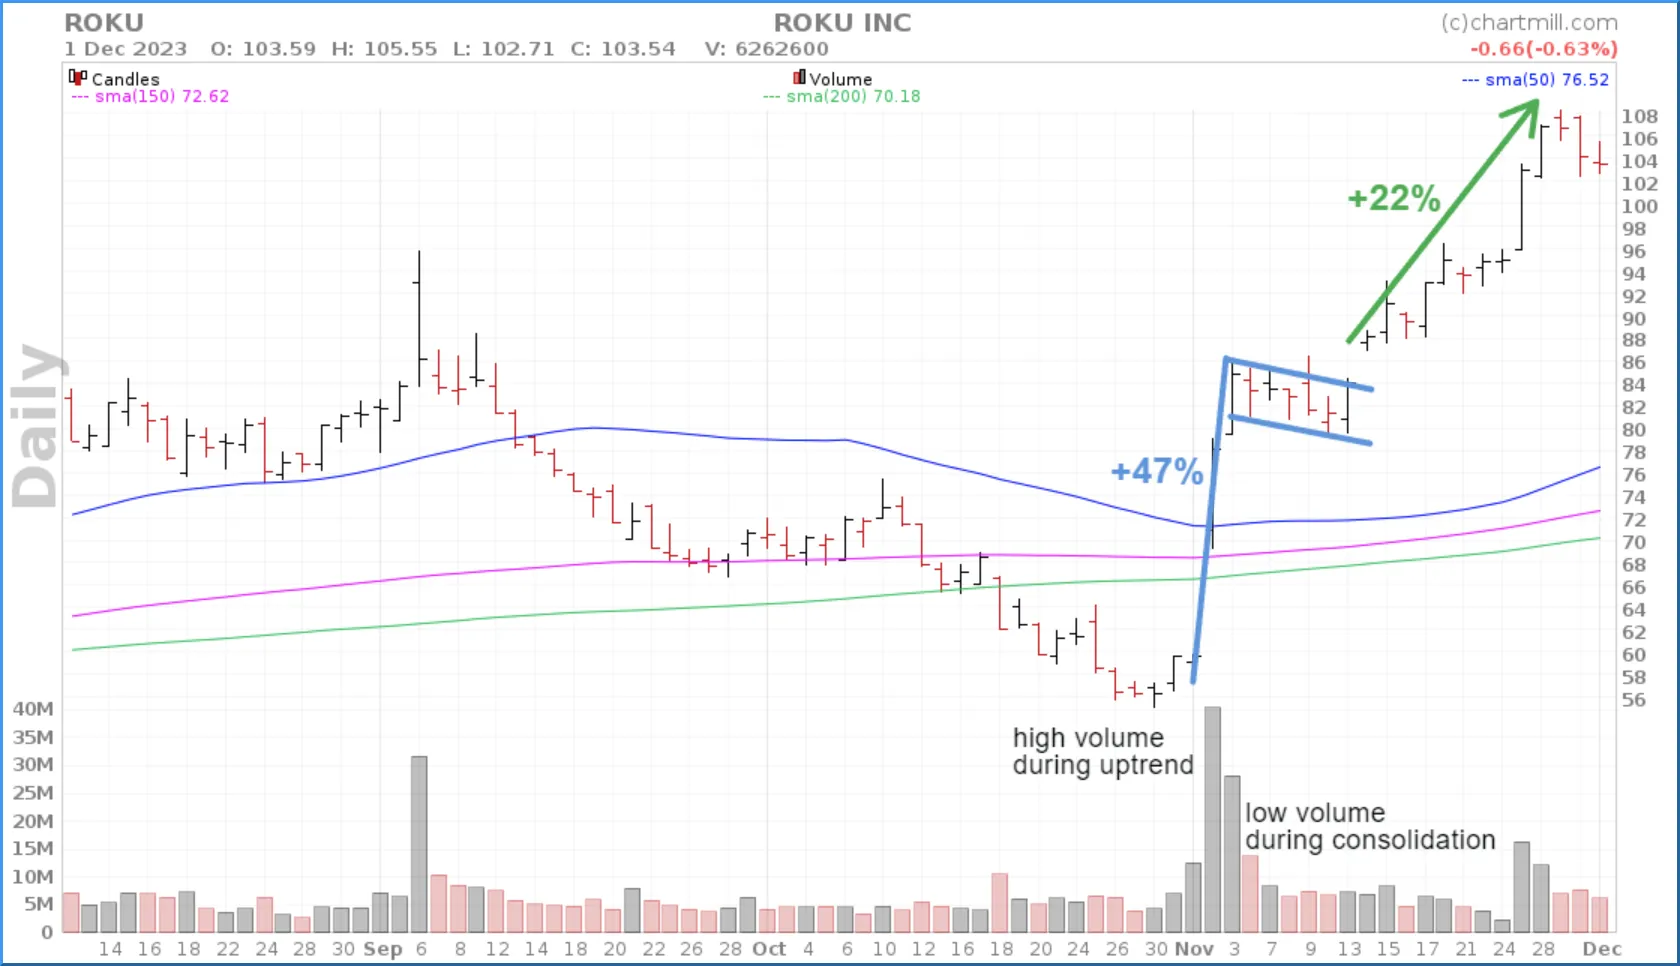
On Nov. 1, Roku (ROKU) published quarterly results on which the stock jumped nearly 50% higher in just three days. A flag pattern formed within which the price moved up and down for six days. Volume was very low compared to the volume before. Eventually, the price opened with a gap up above the flag and a second rise was initiated, reaching another 22% so far.
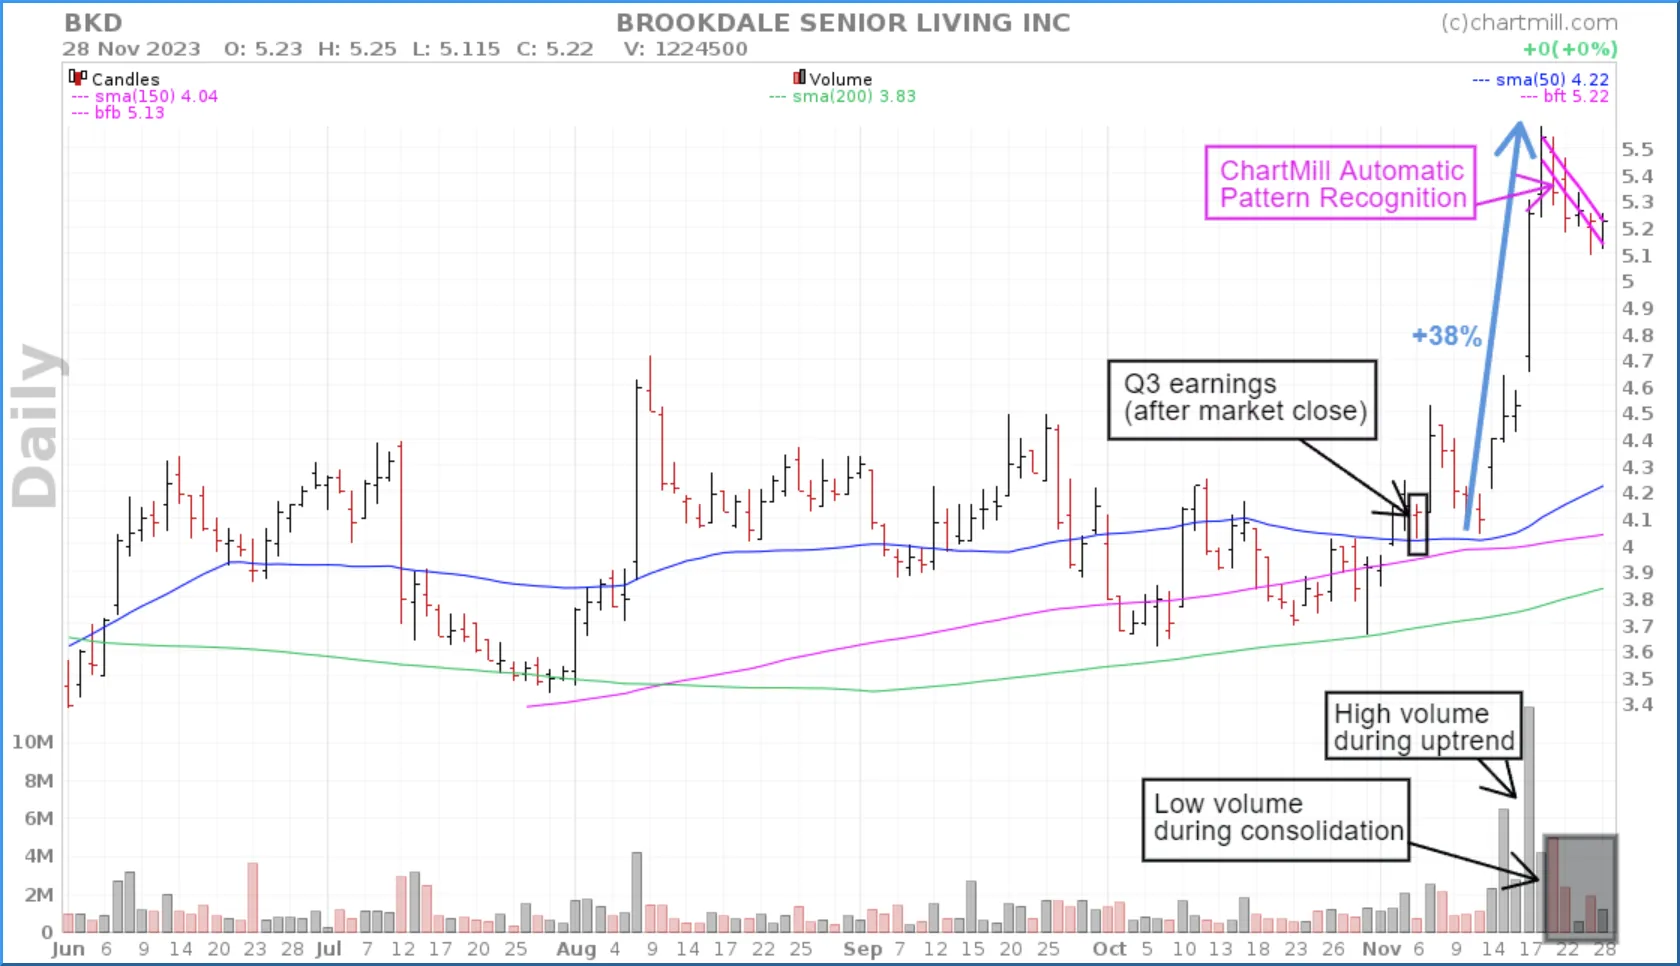
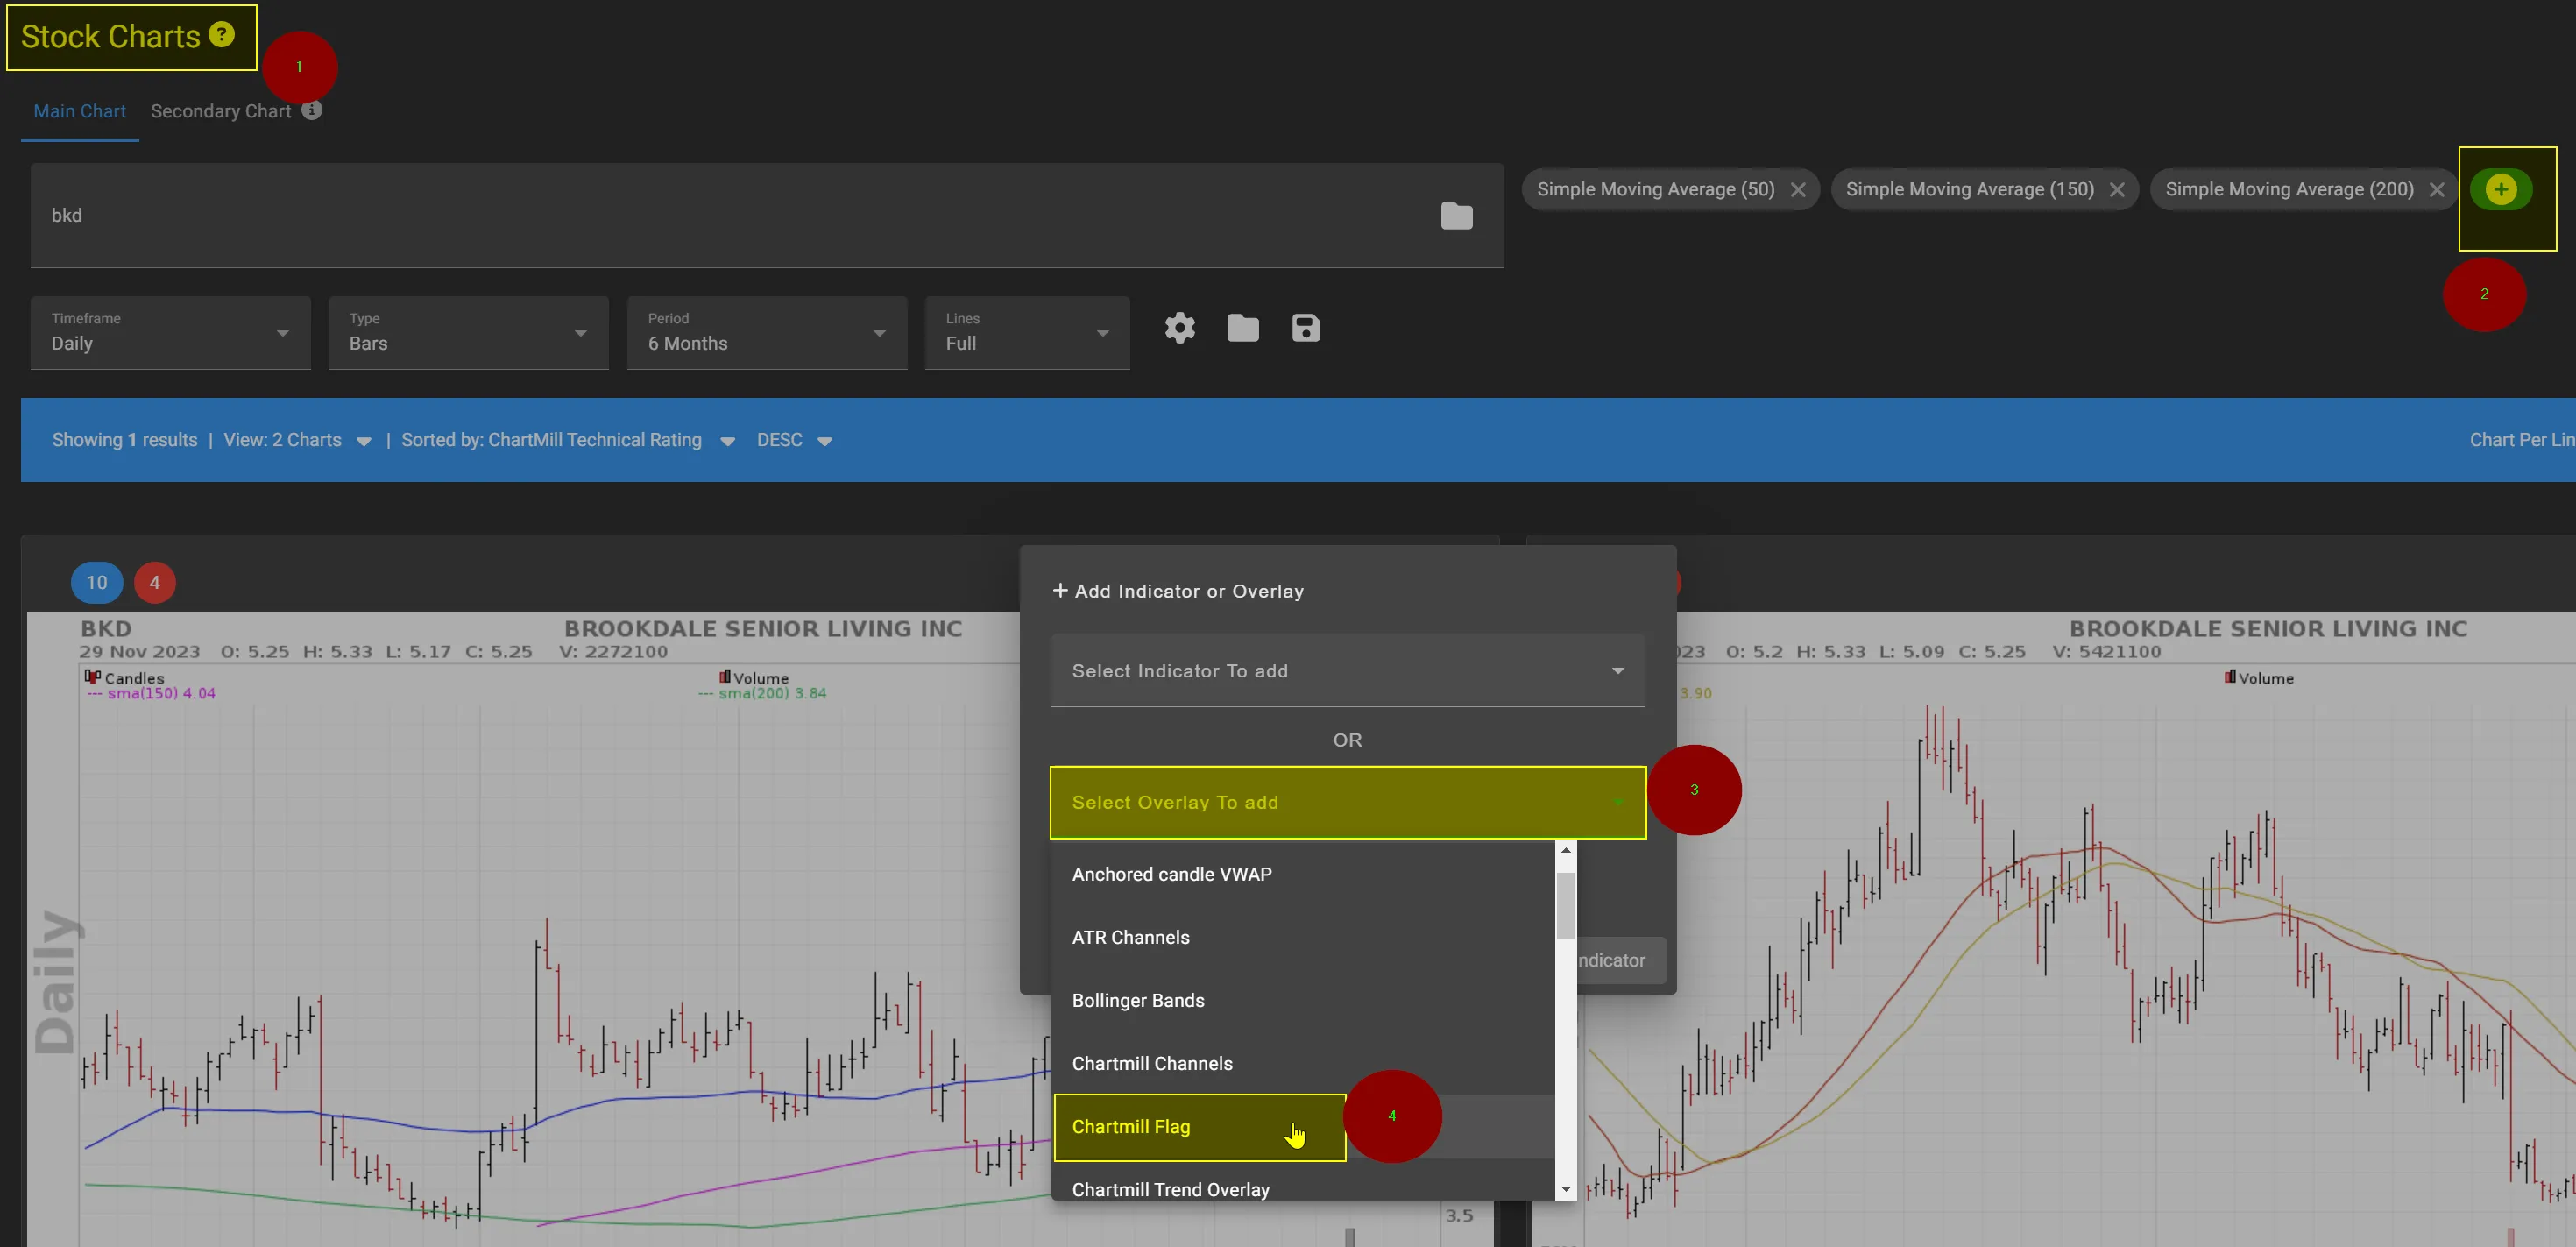
Brookdale Senior Living (BKD) experienced a sharp price increase of more than 38% between November 13 and November 28. Again, we recognize high volume during the increase and low volume during the slightly declining sideways price range. A continuation of the rising trend can be anticipated with relatively little risk if the flag pattern is broken upward.
Tip: The purple lines indicating the flag are automatically drawn by ChartMill. If they are not visible in your chart, add them via 'select overlay to ad'. Then scroll down the drop down menu to 'ChartMill Flag'.
How Do You Scan a High Tight Flag in ChartMill?
ChartMill has a high tight flag pattern screen available that automatically recognizes high tight flag patterns. Because of the specific requirements, the number of results will depend heavily on market conditions. Only in clearly bullish markets will this screen give multiple results.
The strength of this screen lies in the combination of multiple filters.
First, using the Bull Flag filter components, the flag is being defined:
- Bull Flag > Flag Pole above 10%
This selects only stocks that have risen at least 10% just prior to the formation of the flag pattern. This ensures that we are left with those stocks which have risen strongly and where there is thus solid momentum.
- Volume Increase > Volume (Week) 50% Less Than Volume (Previous Week)
This volume filter ensures that volume is less at the time when the price drops back a bit (during the formation of the actual flag pattern). Lower volume during the consolidation phase is an important first indication that the existing positive trend remains intact. This volumefilter does have a drawback if the consolidation period is longer than 1 week. When you get very few or even no results, it is best to remove this volume filter. You then check the results manually. It is important that the volume in the flag section is clearly lower than the volume in the previous rise.
- We subsequently combined this with the Minervini Trend Template Filter which retains only stocks with solid relative strength in a clear bullish trend.
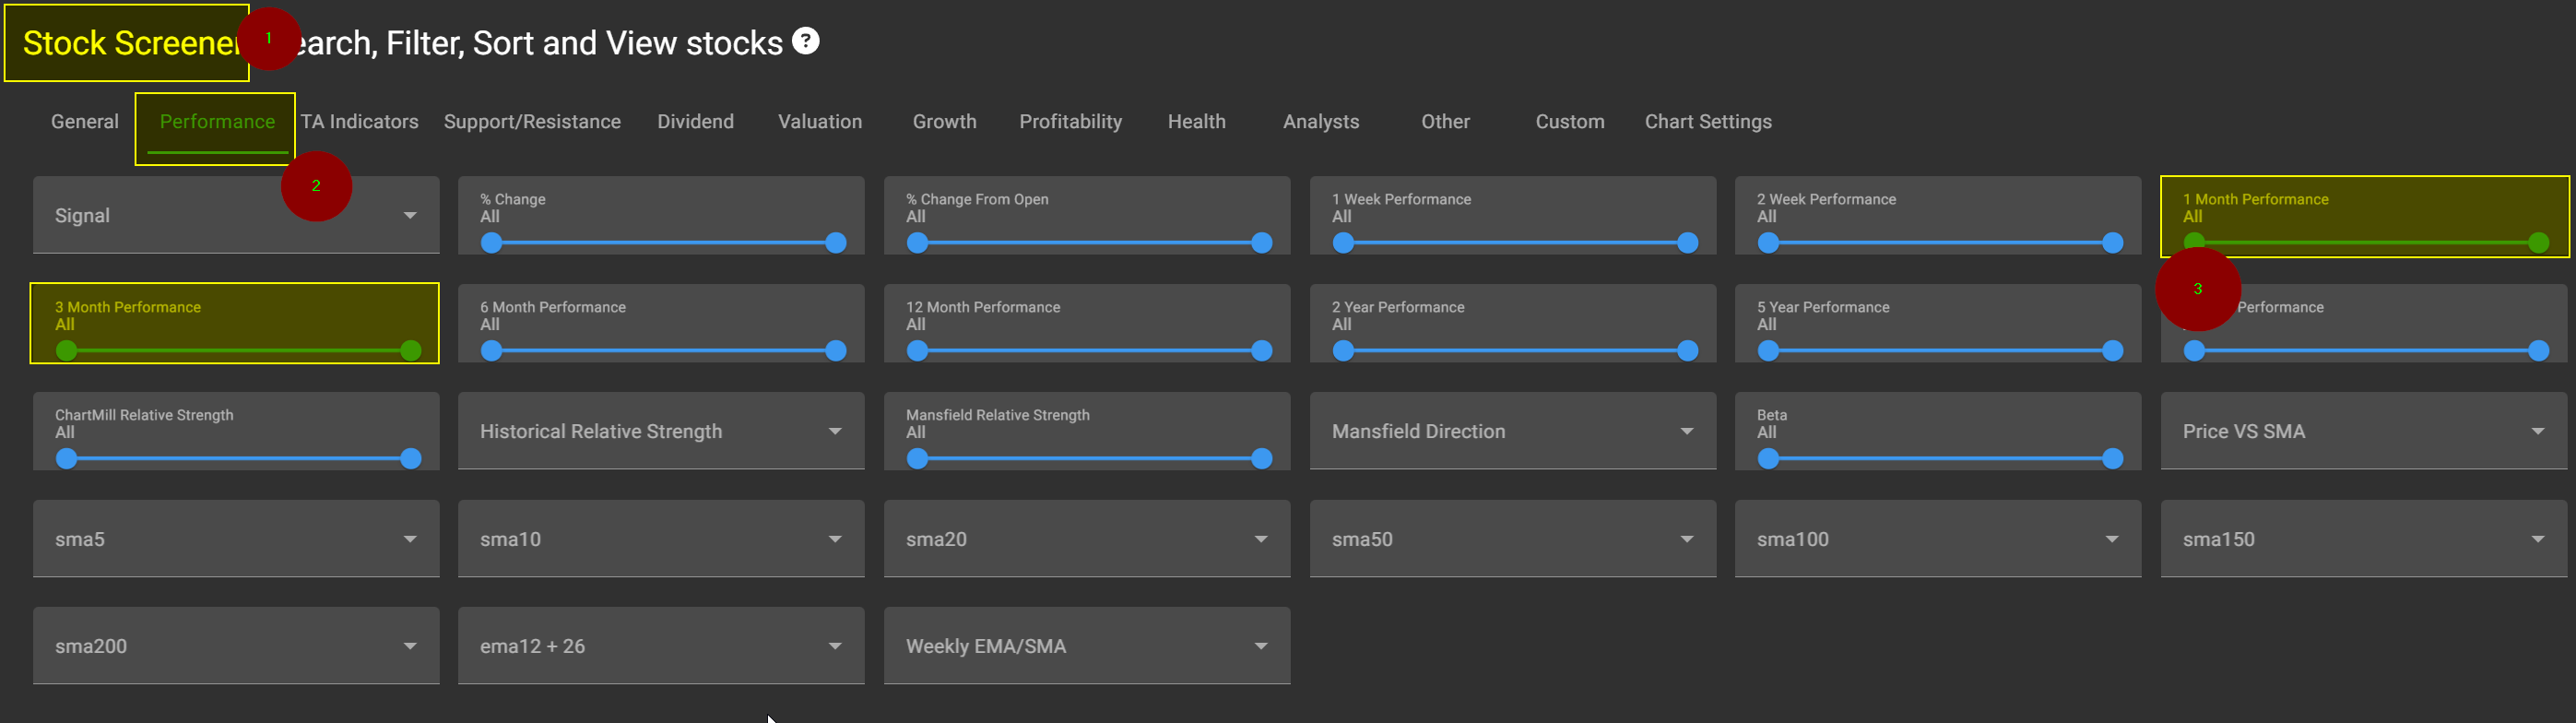
If this basic screen shows a reasonable number of stocks with the above settings, you can further refine the selection by adding a price performance filter that specifies a minimum percentage increase for the last month or past 3 months.
As with other patterns, the outcome is never certain. General market conditions play a major role in whether or not the pattern will be successful. As addressed earlier, this type of setups will do very well in (new) bull markets.
As a matter of fact, it is not at all necessary that the pattern always be successful. If you manage to achieve a risk/reward ratio of more than 2 on the successful trades, your returns will already be positive if only half of the setups succeed.
What's the difference between a high tight flag and a regular bullish flag pattern?
The difference lies mainly in the momentum and strength of the previous rise. A high tight flag usually arises from a base. Specific company news is almost always the trigger of a very strong and sudden rise.
Just because of the very high momentum and the fact that the stop loss can be placed very short below the flag on a new breakout ensures that the entry can be executed with little risk and the potential profit is very high.