
A systematic method for finding high-potential growth stocks combines strict technical screening with fundamental momentum study. The method used here applies Mark Minervini's Trend Template to find stocks in strong uptrends, then adds a High Growth Momentum (HGM) rating to confirm these technically sound companies also have the accelerating earnings and sales typical of market leaders. This two-step process is intended to find stocks with both favorable technicals and the fundamental basis for continued growth.
Technical Strength: Adherence to the Trend Template
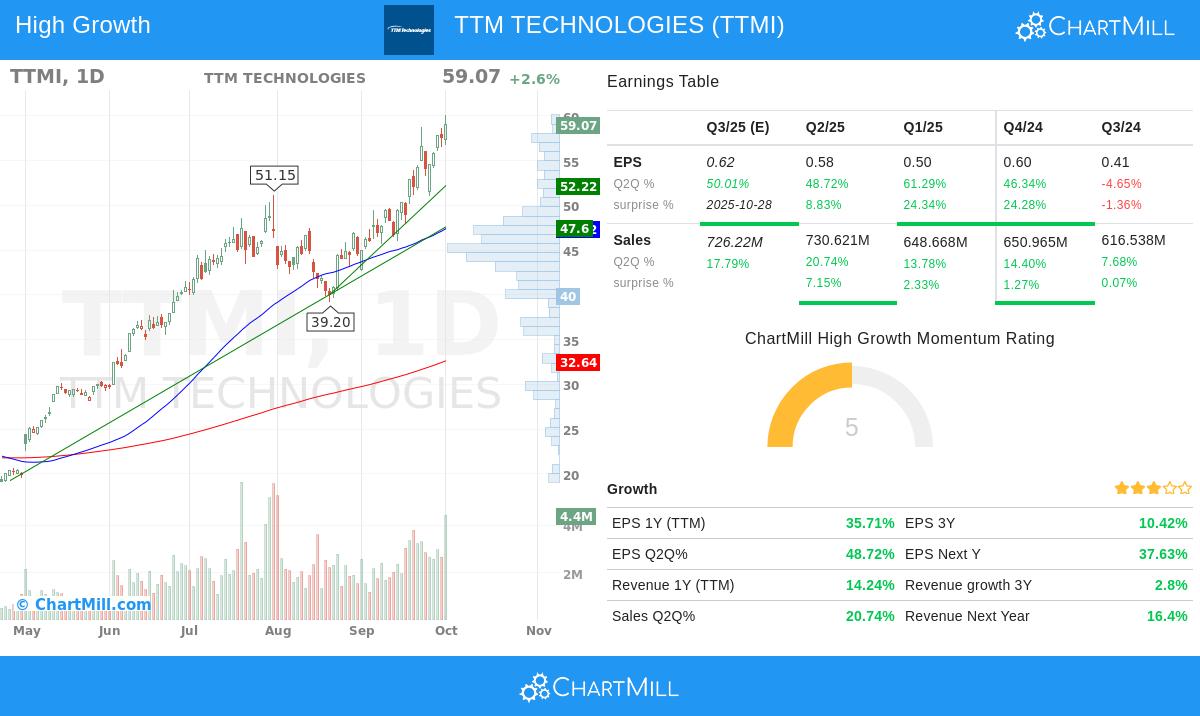
TTM Technologies (NASDAQ:TTMI) presents a strong technical image by meeting the main principles of the Minervini Trend Template. This template is made to filter for stocks in a clear Stage 2 advance, steering clear of basing or declining issues.
The stock's current price action and moving average setup show a solid uptrend:
- Price vs. Moving Averages: The current price of $59.07 trades well above its key moving averages, the 50-day SMA ($47.42), 150-day SMA ($35.09), and 200-day SMA ($32.64). This stacked order is a main requirement of the Trend Template, confirming the stock is in a bull market phase across multiple timeframes.
- Trending Averages: Importantly, these moving averages are not just being passed; they are all moving upwards. The 200-day SMA, for example, has increased from a previous value of $32.47, indicating continued long-term momentum. Also, the 50-day SMA is positioned above both the 150-day and 200-day SMAs, a positive setup that shows accelerating intermediate-term momentum.
- Price Relative to Highs and Lows: The stock is currently within 2% of its 52-week high of $60.10, a signal of strong momentum and leadership. At the same time, it has increased over 270% from its 52-week low of $15.77, well beyond the template's need to be at least 30% above the low, which points to a strong recovery and growth trend.
- Superior Relative Strength: With a ChartMill Relative Strength (CRS) score of 97.32, TTMI is performing better than 97% of all stocks in the market. Minervini notes that stocks with high relative strength, ideally above 70, are frequently the market leaders that produce the largest gains.
Fundamental Momentum: The High Growth Engine
While the Trend Template finds the "when," the High Growth Momentum rating helps confirm the "why" by concentrating on the fundamental acceleration that usually drives sustained price appreciation. TTM Technologies displays several important growth traits.
The company is showing marked improvement in its core profitability measures:
- Earnings Acceleration: The company has reported significant earnings per share (EPS) growth, with the most recent quarter increasing 48.7% year-over-year. This comes after a 61.3% growth in the previous quarter, showing a strong and accelerating pattern.
- Positive Earnings Surprises: TTMI has exceeded EPS estimates in three of the last four quarters, with an average beat of 14%. These positive surprises often draw institutional interest and result in upward changes to future estimates.
- Upward Analyst Revisions: Analysts have raised their EPS estimates for the next fiscal year by more than 7% in the last three months. This upward revision is a key part of the strategy, as it shows increasing optimism about the company's future outlook.
- Sales Growth and Margin Expansion: Revenue growth has been solid, with the last quarter up 20.7% year-over-year. Possibly more significant, the company's profit margin has widened noticeably, improving to 5.68% in the last quarter from 0.79% two quarters before. This indicates not just top-line growth, but also better operational efficiency and possible pricing power.
Technical Analysis Overview
The technical report for TTMI gives a top rating of 10 out of 10, reflecting outstanding technical health. The analysis states that both short-term and long-term trends are positive, and the stock is trading near a new 52-week high with superior relative strength. While the stock's strong performance is a good signal, the report notes that the recent volatile price movement has led to a lower setup rating, indicating investors should look for a possible consolidation period to find a more favorable entry point. For a detailed look at the support levels and full analysis, see the complete technical report for TTMI.
Finding Similar Opportunities
TTM Technologies acts as a leading example of a stock that fits a disciplined growth and momentum strategy. For investors looking to find other companies that meet these strict technical and fundamental standards, the screening process that found TTMI can be repeated. You can examine the live screen and its current results by using this link: High Growth Momentum + Trend Template Screen.
Disclaimer: This is not investment advice. The content is intended to be used for information and education purposes only. It is crucial to conduct your own research and consider your individual financial situation and risk tolerance before making any investment decisions.