
DOUGLAS DYNAMICS INC (NYSE:PLOW) has been identified as a stock that aligns with Mark Minervini’s Trend Template while also exhibiting strong growth momentum. The company, a manufacturer of commercial work truck attachments and equipment, is currently showing technical strength and fundamental growth characteristics that make it worth a closer look.
Why PLOW Fits the Minervini Trend Template
The Minervini Trend Template is designed to identify stocks in strong uptrends with favorable technical conditions. PLOW meets several key criteria:
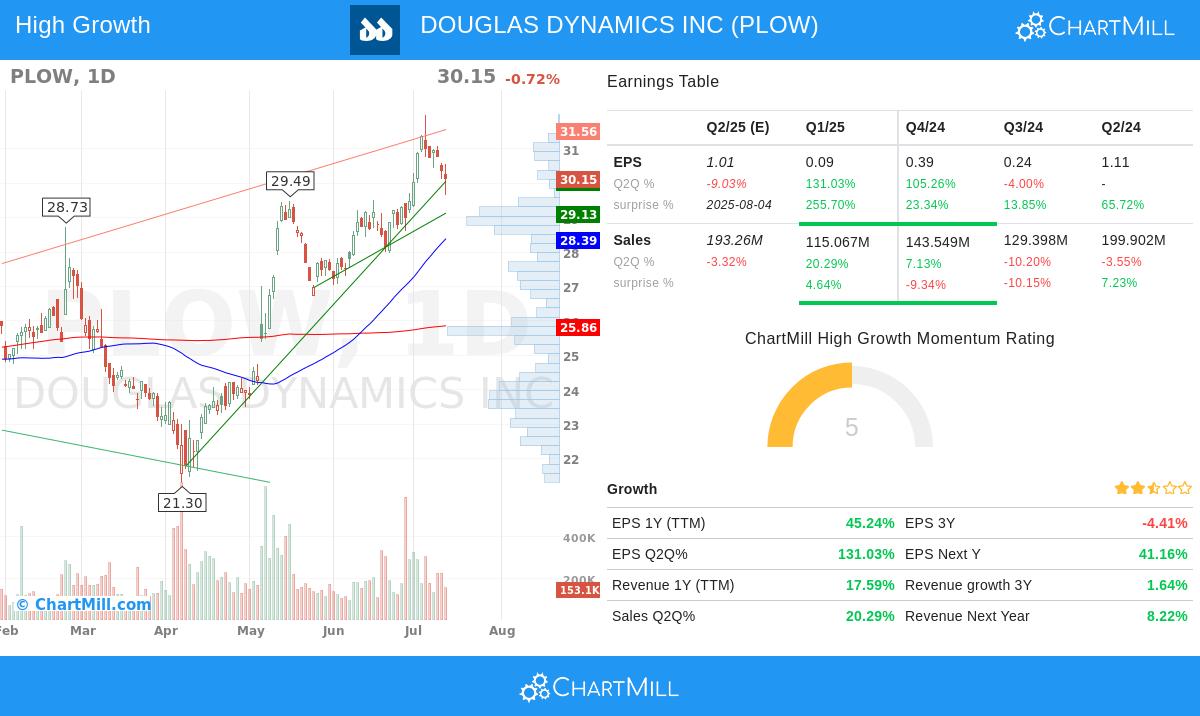
- Price Above Key Moving Averages: The stock is trading above its 50-day ($28.39), 150-day ($25.87), and 200-day ($25.86) moving averages, confirming a bullish trend.
- Upward-Sloping Moving Averages: Both the 150-day and 200-day moving averages are trending upward, reinforcing long-term strength.
- Relative Strength: With a ChartMill Relative Strength score of 82.21, PLOW outperforms 82% of all stocks, indicating strong momentum.
- Price Near 52-Week High: The stock is within 6% of its 52-week high ($31.98), a sign of sustained upward momentum.
High Growth Momentum (HGM) Highlights
Beyond technical strength, PLOW demonstrates strong growth fundamentals:
- Earnings Growth: EPS growth over the past year (TTM) stands at 45.24%, with quarterly growth (Q2Q) surging 131.03%.
- Revenue Growth: Sales growth (Q2Q) is up 20.29%, while full-year revenue growth (FY) shows a steady 5.74% increase.
- Profit Margins: The latest quarterly profit margin is 12.17%, reflecting improved operational efficiency.
- Analyst Revisions: EPS estimates for next year have been revised upward by 8.66% over the past three months, signaling optimism.
Technical Outlook
According to ChartMill’s technical report, PLOW has a strong rating of 9 out of 10, with both short-term and long-term trends positive. The stock is consolidating near resistance at $31.35, presenting a potential breakout opportunity. A pullback to support around $30.14 could offer a favorable entry point with a well-defined stop-loss level.
For a deeper technical breakdown, review the full technical analysis report.
Our High Growth Momentum + Trend Template screener lists more stocks that meet these criteria and is updated daily.
Disclaimer
This is not investment advice. The observations are based on current data, but market conditions can change. Always conduct your own research before making investment decisions.