
Ouster Inc (NASDAQ:OUST) has become an interesting candidate for investors using a combined technical and fundamental growth strategy. The stock recently appeared through a screening process that joins Mark Minervini’s Trend Template with high growth momentum criteria, made to find equities showing both solid price trends and quickening business fundamentals. This dual-focus method looks for securities not only in clear uptrends but also those showing operational gains that might support more price increases.
Technical Strength Through the Minervini Lens
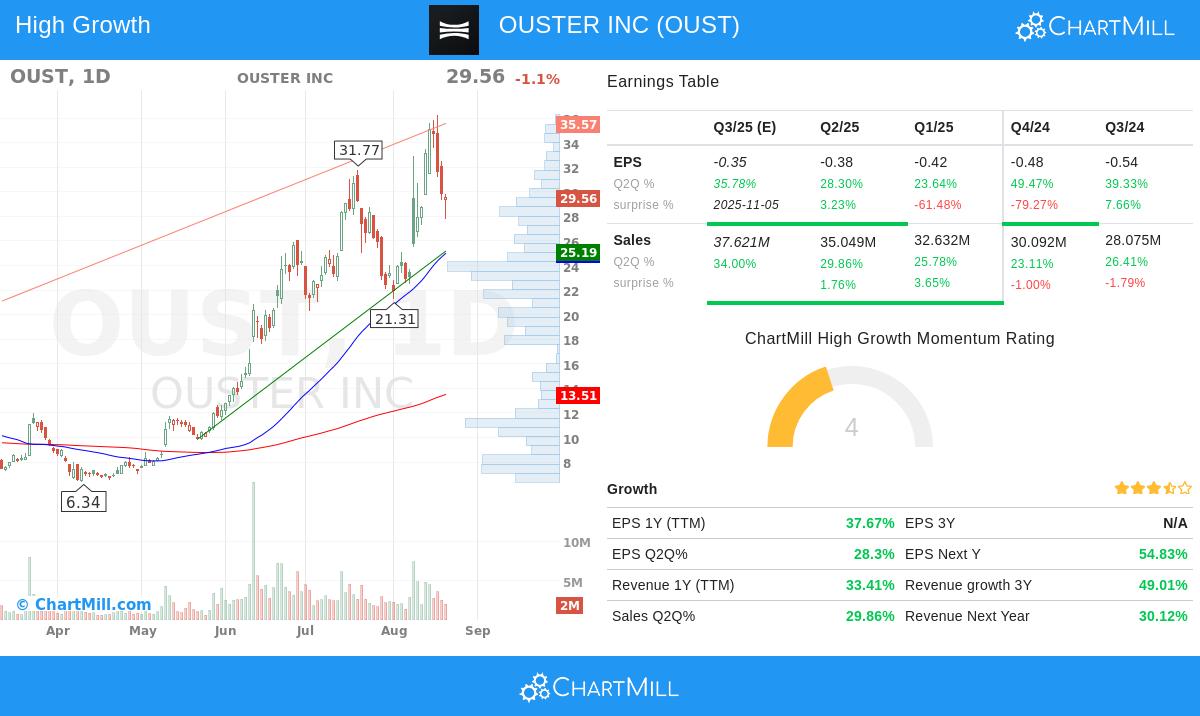
Ouster meets the main technical needs of Minervini’s Trend Template, which is made to filter for stocks in a clear Stage 2 advance. The current price of $29.56 trades well above its key moving averages, the 50-day ($25.01), 150-day ($14.63), and 200-day ($13.51), all of which are also moving higher. This alignment points to continued buying pressure across multiple timeframes. Furthermore, the stock is trading 407% above its 52-week low of $5.84 and within 19% of its 52-week high of $36.25, traits Minervini links with market leadership and ongoing momentum. A strong relative strength (RS) rating of 99.18 shows OUST is doing better than almost all other stocks in the market, a key part of the strategy that concentrates on the top performers.
Fundamentals Driving High Growth Momentum
Beyond the attractive chart, Ouster’s fundamental profile supports its high growth momentum (HGM) rating. The company has shown major gain in its financial metrics, a main focus for growth investors looking for quickening performance. Revenue growth has been solid, with a 33.4% increase year-over-year (TTM) and recent quarterly sales growth coming in at nearly 30%. Even more notable is the path of its earnings per share (EPS), which, while still negative, has shown major improvement. The EPS growth rate has quickened noticeably, with recent quarterly figures showing year-over-year gains of 28.3%, 23.6%, and 49.5% over the past three quarters. This pattern of quickening growth, especially from a very negative base, often draws institutional interest and can be a strong force for more price movement. Analyst sentiment has also become positive, with EPS estimates for next year adjusted upward by over 9% in the last three months.
Synthesizing the Report and Opportunity
A review of Ouster’s technical analysis report gives a perfect rating of 10, confirming outstanding technical health with positive long and short-term trends. The report notes solid performance relative to both the wider market and its industry peers. While the excellent technical rating is clear, the report also warns that recent volatility might need investors to wait for a more settled entry point to improve risk management, a typical thought when trading high-momentum names.
For investors looking for other opportunities that mix solid technical trends with high-growth fundamentals, this High Growth Momentum + Trend Template screen can be a useful starting point for more research.
Disclaimer: This is not investment advice. The content provided is for informational and educational purposes only. All investment decisions carry risk, and individuals should conduct their own research or consult a qualified financial advisor before making any investment decisions.