
Technical analysis investors often look for stocks displaying both solid basic momentum and clear consolidation patterns that indicate possible breakouts. One methodical process uses filters for securities with high technical ratings, which assess general trend strength, paired with high setup quality scores that pinpoint narrow trading ranges before possible moves. This system helps identify equities that are not only trending well but also providing clear risk-reward measures for entry.
LATAM AIRLINES GROUP SA-ADR (NYSE:LTM) currently shows a profile that fits this plan, displaying solid technical basics paired with a notable consolidation pattern. The airline holding company, which provides passenger and cargo air transportation services across South America, seems to be gathering energy for its next notable price move.
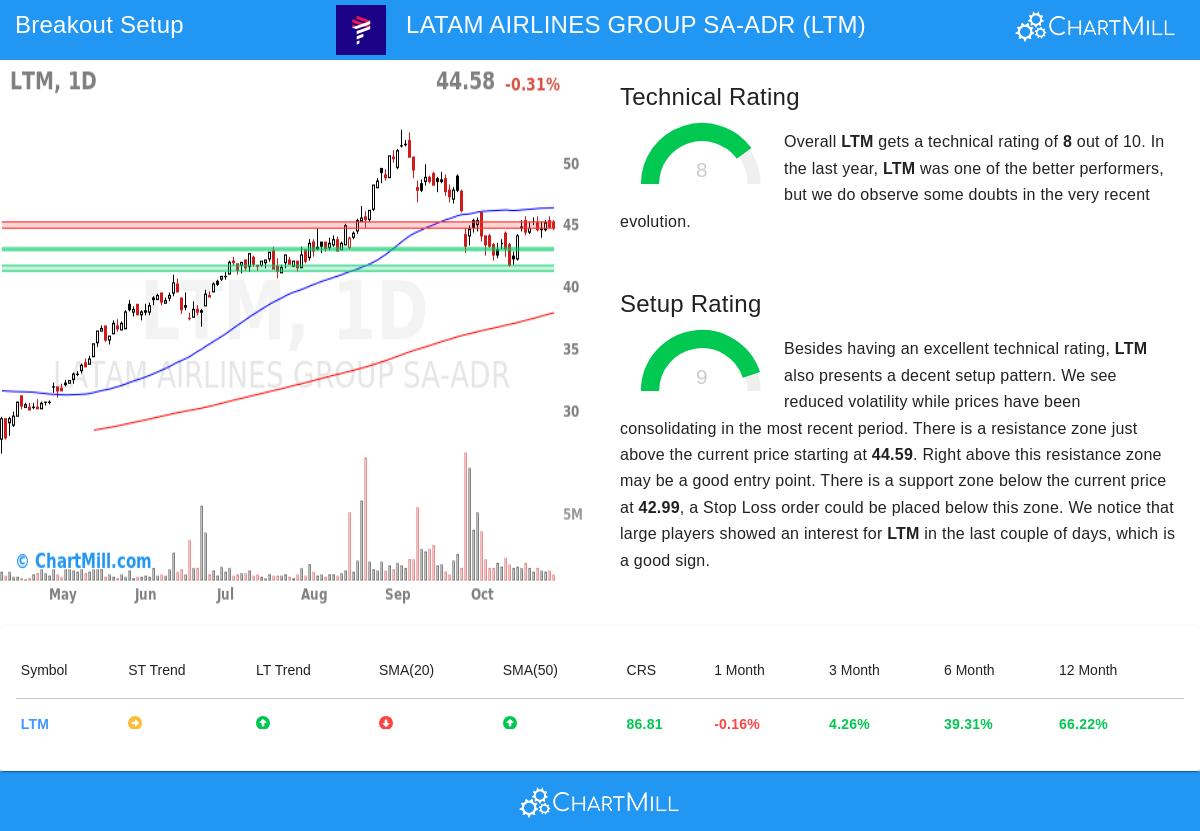
Technical Strength Evaluation
LATAM Airlines shows notable technical condition with a ChartMill Technical Rating of 8 out of 10, signaling solid basic momentum. This rating assesses several elements including relative strength, trend direction, and moving average placement across different time periods.
Important technical notes include:
- The long-term trend stays positive while the short-term trend has become neutral
- The stock performs better than 86% of all stocks in yearly performance comparisons
- Within the Passenger Airlines industry, LTM performs better than 80% of its 21 competitors
- Price action shows the stock trading in the higher part of its 52-week range
- Multiple moving averages (SMA50, SMA100, SMA200) continue moving upward
The technical rating's value is in its capacity to find stocks with confirmed momentum, which raises the chance that breakouts from consolidation patterns will result in continued upward movement instead of false signals.
Setup Quality Evaluation
The setup quality score of 9 out of 10 points to a very good consolidation pattern that has formed in recent trading sessions. This high rating indicates the stock has been trading in a narrow range with lowering volatility, forming conditions suitable for a possible breakout.
Notable setup features include:
- A clear resistance area between $44.59 and $45.10 formed by horizontal resistance and moving averages
- Solid support areas found at $42.80-$42.99 and $41.13-$41.57
- Lowered volatility paired with price consolidation in the $41.41-$45.91 range over the last month
- Recent attention from large players as measured by the Effective Volume indicator
The setup quality measure is important because it finds periods where risk can be clearly specified through support levels, while resistance areas provide clear breakout confirmation points. This creates good risk-reward situations for technical traders.
Trade Structure Points
Based on the technical and setup evaluation, a possible trade structure appears with specific details. The detailed technical report indicates an entry point just above the resistance area at $45.11, which would confirm breakout momentum. A stop loss placed below the main support at $42.79 would limit downside risk to about 5.14%, providing clear risk details.
This structure shows the breakout method where traders wait for price to confirm direction by moving past consolidation boundaries, then manage risk through clearly specified support levels. The current setup in LTM provides this mix of momentum confirmation and risk specification.
Market Environment and Volume Points
While the wider S&P 500 keeps positive trends in both short and long-term time periods, LTM displays some difference with its neutral short-term trend. However, the stock's solid relative performance against market competitors and its placement in the higher part of its yearly range indicate basic strength.
Volume patterns show a mixed image, with the 50-day average volume of about 1.95 million shares indicating good liquidity, while recent sessions have displayed much lower volume. Traders watching this setup would preferably want to see increasing volume on any breakout above the resistance area to confirm institutional activity.
Finding Other Opportunities
For investors wanting to find similar technical setups, the Technical Breakout Setups screen frequently finds stocks meeting these requirements, providing a methodical way to find possible breakout candidates across the market.
Disclaimer: This evaluation is based on technical indicators and historical price patterns and should not be considered investment advice. All trading and investment decisions involve risk, and individuals should perform their own research and consult with financial advisors before making investment decisions. Past performance does not guarantee future results.