
The "High Growth Momentum + Trend Template" screen joins two effective stock selection methods to find companies with both good technical momentum and notable fundamental growth features. This method brings together Mark Minervini's Trend Template, which finds stocks in clear uptrends using particular moving average and price action rules, with a High Growth Momentum score that reviews companies showing quickening earnings, revenue expansion, and favorable analyst changes. The combination of these two approaches helps investors find stocks that display not only good price momentum but also have the fundamental reasons to maintain that momentum.
Technical Strength and Trend Template Adherence
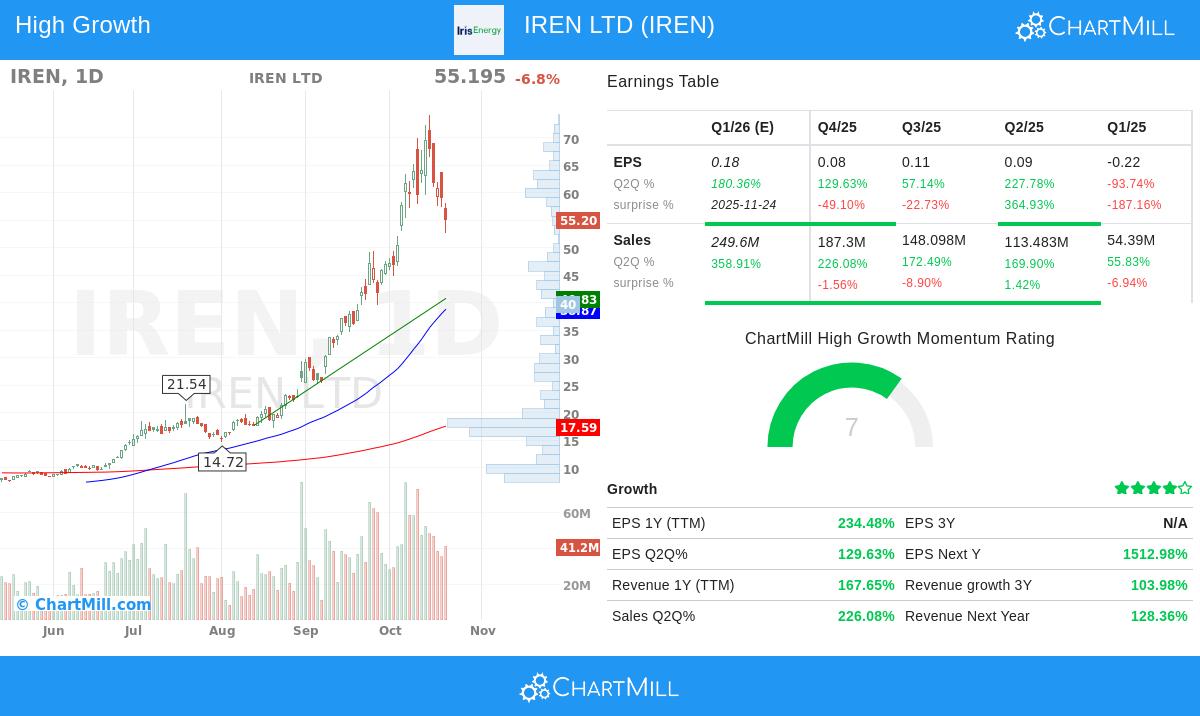
IREN LTD (NASDAQ:IREN) shows very good adherence to Minervini's Trend Template rules, which is important for finding stocks in lasting uptrends. The template's moving average rules make sure a stock is moving upward over several time periods, lowering the chance of identifying short-lived recoveries inside longer-term downward trends.
The stock's present technical setup displays:
- Price trading at $55.195, much higher than all main moving averages (50-day: $38.87, 150-day: $20.04, 200-day: $17.59)
- All moving averages moving upward with correct order (50-day > 150-day > 200-day)
- Current price located 975% higher than its 52-week low of $5.13 and within 25.6% of its 52-week high of $74.15
- Very good relative strength rank of 99.33, doing better than almost every other stock
This technical base is especially important because Minervini's studies indicate that stocks fulfilling these rules often keep their upward momentum, as they have already shown continued institutional purchasing and market leadership.
Notable Growth Measurements
The High Growth Momentum part of the screening method centers on finding companies with quickening fundamental results, which frequently comes before continued price gains. IREN's growth measurements show a company undergoing fast expansion in several areas.
The company's earnings results are notable with:
- TTM EPS growth of 234.48% year-over-year
- Quarterly EPS growth speeding up from 57.14% to 129.63% in the latest quarters
- Four straight quarters of EPS estimate beats with a typical surprise of 26.48%
- Analyst EPS revisions for the next year raised by 14.35% over three months
Revenue expansion measurements are just as strong:
- TTM revenue growth of 167.65% year-over-year
- Quarterly revenue growth speeding up from 172.49% to 226.08%
- Analyst revenue revisions for the next year raised by 29.46% over three months
- Good forward-looking estimates showing 358.91% growth expected next quarter
The getting better profit margin path—from 15.79% to 53.39% over recent quarters—shows the company's ability to change top-line growth into bottom-line profitability, a main feature of successful growth companies.
Market Situation and Relative Strength
Working in the competitive Software industry, IREN's very good relative strength rank of 99.33 shows it is doing better than 98% of its 285 industry competitors. This leading place is important because Minervini notes that real market leaders usually come from sectors with good momentum and often direct market recoveries. The stock's 496.70% twelve-month performance is much better than the wider market, yet it still trades reasonably close to its highs, indicating continued institutional interest instead of speculative retail trading.
Technical Analysis Summary
According to ChartMill's detailed technical report, IREN gets a perfect technical score of 10 out of 10, showing very good technical health across both short and long-term periods. The report mentions steady performance compared to the total market, with both short-term and long-term trends clearly positive. While the setup score of 4 suggests present instability may create difficulties for exact entry timing, the basic technical strength stays clear. The in-depth technical analysis report gives more detailed information on support points, resistance zones, and particular trading points for interested investors.
Screening Method and Additional Study
For investors looking for similar high-growth, technically sound chances, the High Growth Momentum + Trend Template screen methodically finds companies meeting these strict rules. This method joins the structure of trend-following with the growth investor's attention on fundamental quickening, possibly giving a measured way to find stocks in the beginning parts of major price moves.
Disclaimer: This analysis is for informational and educational purposes only and does not constitute investment advice. All investments carry risk, and past performance is not indicative of future results. Investors should conduct their own research and consult with financial advisors before making investment decisions. Please read our full disclaimer for more information.