
Investors using technical analysis often look for stocks that are not only in a strong upward move but are also forming a constructive pattern that could signal the next move higher. One systematic way to find such opportunities is by screening for stocks with high proprietary ratings for both technical condition and setup quality. This method filters for equities that are market leaders, demonstrating strong relative performance and positive trends, while also trading in a tight consolidation range, offering a clear potential entry point with defined risk. A recent screen using this strategy has identified defense contractor GENERAL DYNAMICS CORP (NYSE:GD) as a candidate showing these traits.
Technical Condition: A Market Leader in an Uptrend
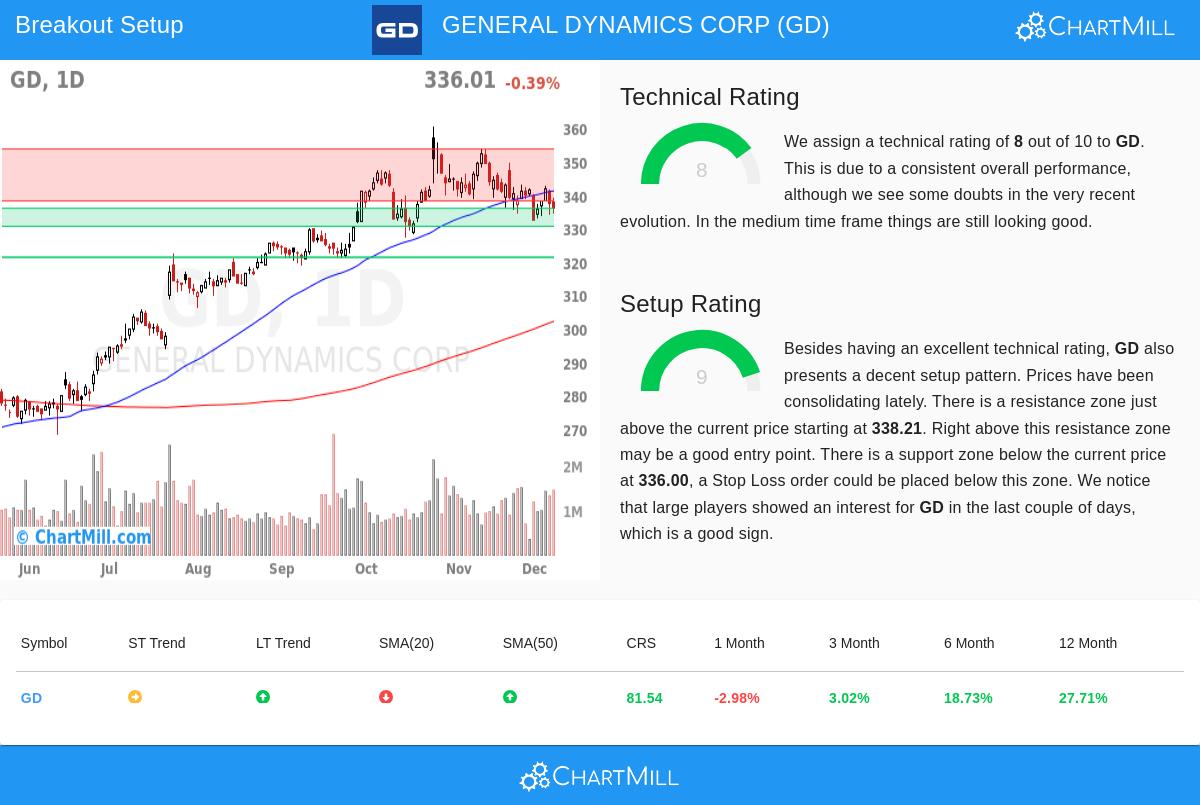
The base of a breakout strategy is a technically sound underlying stock. General Dynamics receives a solid ChartMill Technical Rating of 8 out of 10, showing it is in a confirmed upward move. This score comes from an examination of multiple timeframes and factors, including relative performance and moving average alignment. A closer view of the full technical report shows the main reasons for this rating:
- Long-Term Trend: The long-term trend for GD is classified as positive, a key part for trend-following strategies. The stock trades above its key rising moving averages (50-day, 100-day, and 200-day), confirming the wider bullish structure.
- Superior Relative Performance: Over the past year, GD has performed better than about 81% of all stocks in the market. This strong relative performance is a sign of market leadership, a main filter in the breakout screen method, as leaders often continue to lead.
- Consistent Price Increase: The technical report notes a "nice and consistent pattern of rising prices" over the yearly period, with six-month and twelve-month performance figures of +18.7% and +27.7%, respectively.
While the short-term trend is currently neutral and the stock is trading in the lower half of its recent one-month range, the overall technical picture remains sound. For a breakout setup to have high-probability follow-through, it must happen within the context of a prevailing upward move, a condition which GD meets.
Setup Quality: A Coiled Spring Pattern
A strong trend alone is not a buy signal, entering at an extended point can lead to immediate pullbacks. The second key part is the "Setup Quality," which measures the consolidation pattern. GD scores a very good 9 out of 10 here, indicating it is forming a potentially explosive base.
- Consolidation and Resistance: The stock has been trading in a consolidation range between approximately $332 and $354 over the past month. Prices are currently near the lower end of this range, with a defined resistance zone overhead starting at $338.21. A decisive move above this zone could signal the end of consolidation and the start of a new upward impulse.
- Clear Support for Risk Management: Below the current price, a significant support zone exists from $330.59 to $336.00, formed by a combination of trendlines and moving averages. This provides a logical area to place a protective stop-loss order, allowing for precise risk definition, a key part of disciplined technical trading.
- Institutional Interest: The setup analysis notes that large players have shown interest in GD in recent days, as measured by the Effective Volume indicator. This can be a confirming signal that accumulation is happening during the consolidation phase.
The combination of a high technical rating and a high setup rating is exactly what the Technical Breakout screen is made to find. It spots leading stocks that are pausing, offering a strategic entry point with a favorable risk/reward profile should the pause resolve to the upside.
Finding More Opportunities
The case of General Dynamics shows the type of opportunity this screening method can reveal. For investors interested in reviewing a new list of similar technical setups daily, the process is made efficient through the dedicated analyzer tool.
You can find today's list of qualifying breakout setups by visiting the Technical Breakout Setups screen.
Disclaimer: This article is for informational purposes only and does not constitute investment advice, a recommendation, or an offer to buy or sell any security. The analysis is based on technical data and automated scoring models. Investors should conduct their own due diligence, consider their risk tolerance, and consult with a financial advisor before making any investment decisions. Past performance is not indicative of future results.