
CISCO SYSTEMS INC (NASDAQ:CSCO) was identified as a Technical Breakout Setup Pattern by our stockscreener. Such a pattern occurs when we see a pause in a strong uptrend: after a strong rise the stock is consolidating a bit and at some point the trend may be continued. Whether this actually happens can not be predicted of course, but it may be a good idea to keep and eye on NASDAQ:CSCO.
In-Depth Technical Analysis of NASDAQ:CSCO
Every day, ChartMill assigns a Technical Rating to each stock, providing a score ranging from 0 to 10. This rating is determined by evaluating various technical indicators and properties.
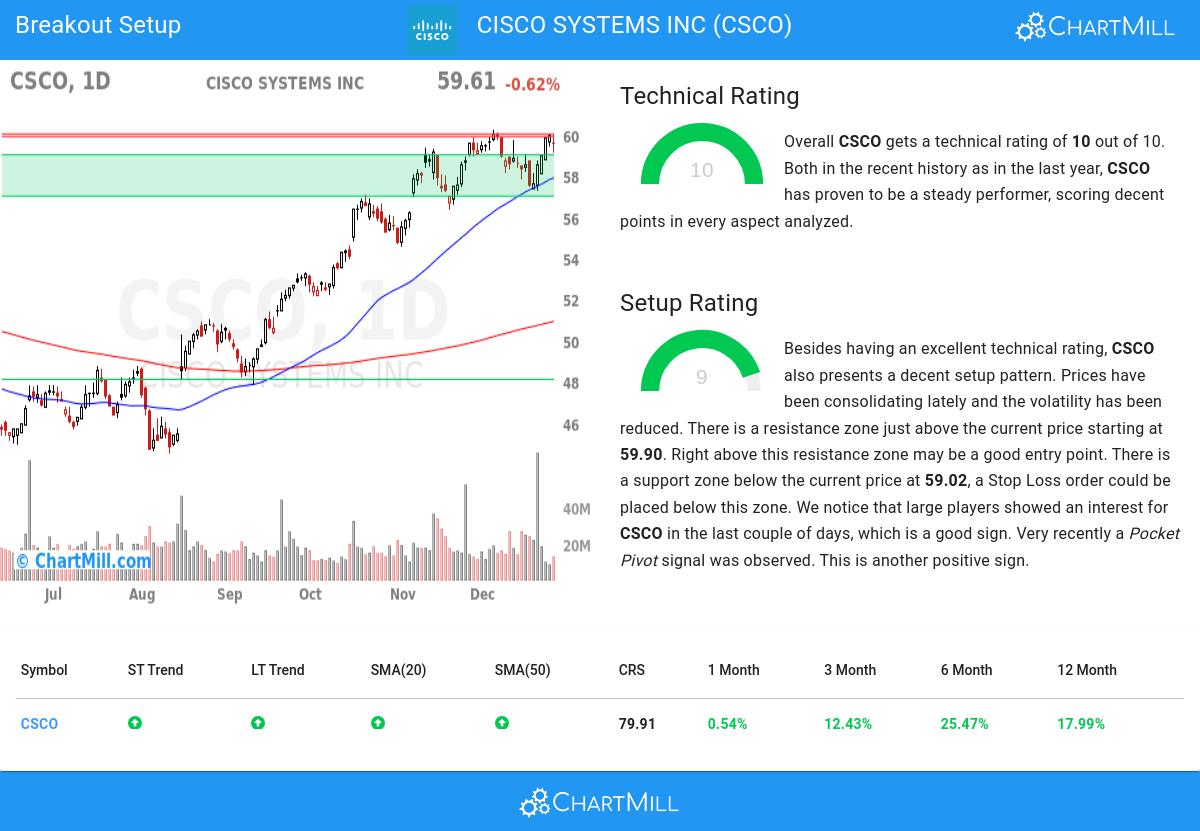
We assign a technical rating of 10 out of 10 to CSCO. Both in the recent history as in the last year, CSCO has proven to be a steady performer, scoring decent points in every aspect analyzed.
- The long and short term trends are both positive. This is looking good!
- Looking at the yearly performance, CSCO did better than 79% of all other stocks. On top of that, CSCO also shows a nice and consistent pattern of rising prices.
- CSCO is currently trading near its 52 week high, which is a good sign. The S&P500 Index is trading in the upper part of its 52 week range, but not near new highs, so CSCO is leading the market.
- CSCO is an average performer in the Communications Equipment industry, it outperforms 48% of 51 stocks in the same industry.
- In the last month CSCO has a been trading in a tight range between 57.27 and 60.23.
Check the latest full technical report of CSCO for a complete technical analysis.
How do we evaluate the setup for NASDAQ:CSCO?
Alongside the Technical Rating, ChartMill assigns a Setup Rating to evaluate the consolidation level of a stock. This rating, ranging from 0 to 10, is updated daily and considers various short-term technical indicators. The current setup rating for NASDAQ:CSCO is 9:
CSCO has an excellent technical rating and also presents a decent setup pattern. Prices have been consolidating lately and the volatility has been reduced. There is a resistance zone just above the current price starting at 59.90. Right above this resistance zone may be a good entry point. There is a support zone below the current price at 59.02, a Stop Loss order could be placed below this zone. We notice that large players showed an interest for CSCO in the last couple of days, which is a good sign. Another positive sign is the recent Pocket Pivot signal.
Trading setups like NASDAQ:CSCO
One way to play this would be to wait for the actual breakout to happen and buy when the stock breaks out above the current consolidation zone. A possible place for a stop loss would be below this zone.
Of course, there are many ways to trade or not trade NASDAQ:CSCO and this article should in no way be interpreted as trading advice. The article is purely based on an automated technical analysis and just points out the technical observations. Always make your own analysis and trade at your own responsibility.
Our Breakout screener lists more breakout setups and is updated daily.
Disclaimer
This article should in no way be interpreted as advice. The article is based on the observed metrics at the time of writing, but you should always make your own analysis and trade or invest at your own responsibility.


