Death Cross Stocks Chart Pattern
By Kristoff De Turck - reviewed by Aldwin Keppens
~ 5 minutes read - Last update: Oct 11, 2023

What Is A Stock Market Death Cross?
The death cross is a pattern that forms when the short-term price average falls below the long-term price average.
This is an indication that the prevailing bullish trend is no longer valid and changes to a bearish trend.
By default, a period of 50 days is used for the short-term average while 200 days is applied for the long-term average.
Thus, for the short-term average, a period of about 2 months is considered (since the set period of 50 days does not take into account the days when the financial markets are closed).
Some Examples Of Death Crosses
Below are two examples of price charts where a death cross has occurred.
Google Death Cross Stock
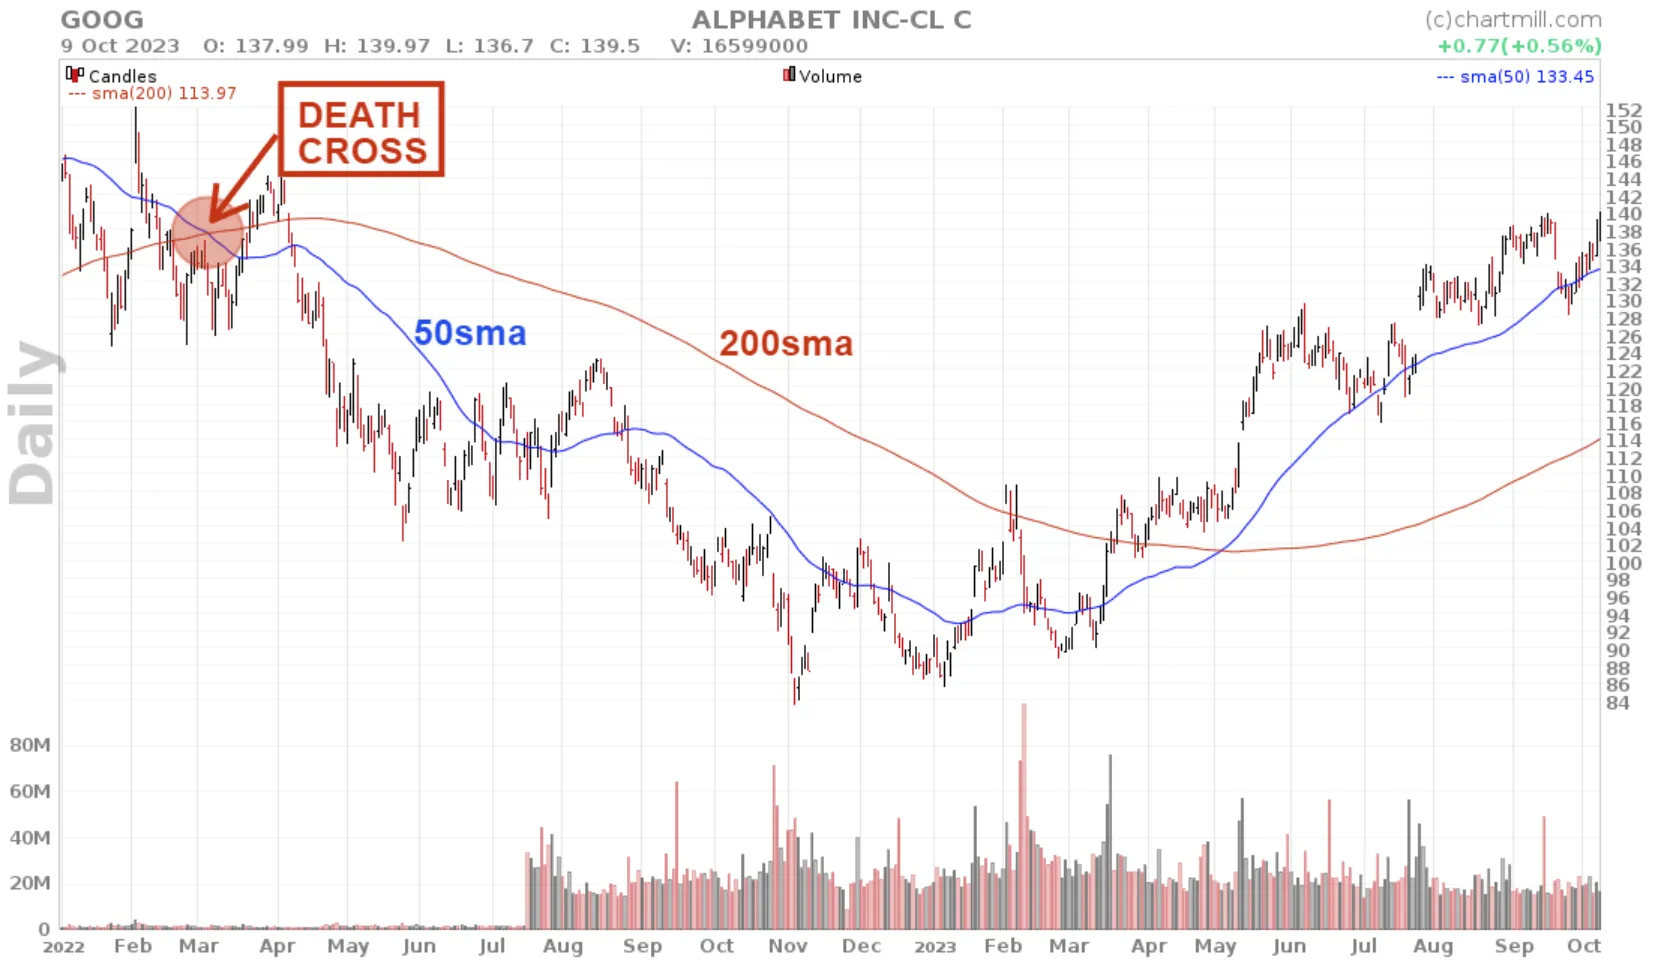
Alphabet shares showed a death cross on date of March 04, 2022 with a closing price at $132.12. Initially, the price seemed to recover fairly quickly at first but eventually went sharply lower with an early November low at $83.45. A price drop of more than 35% over a period of about 9 months.
Garmin Death Cross Stock
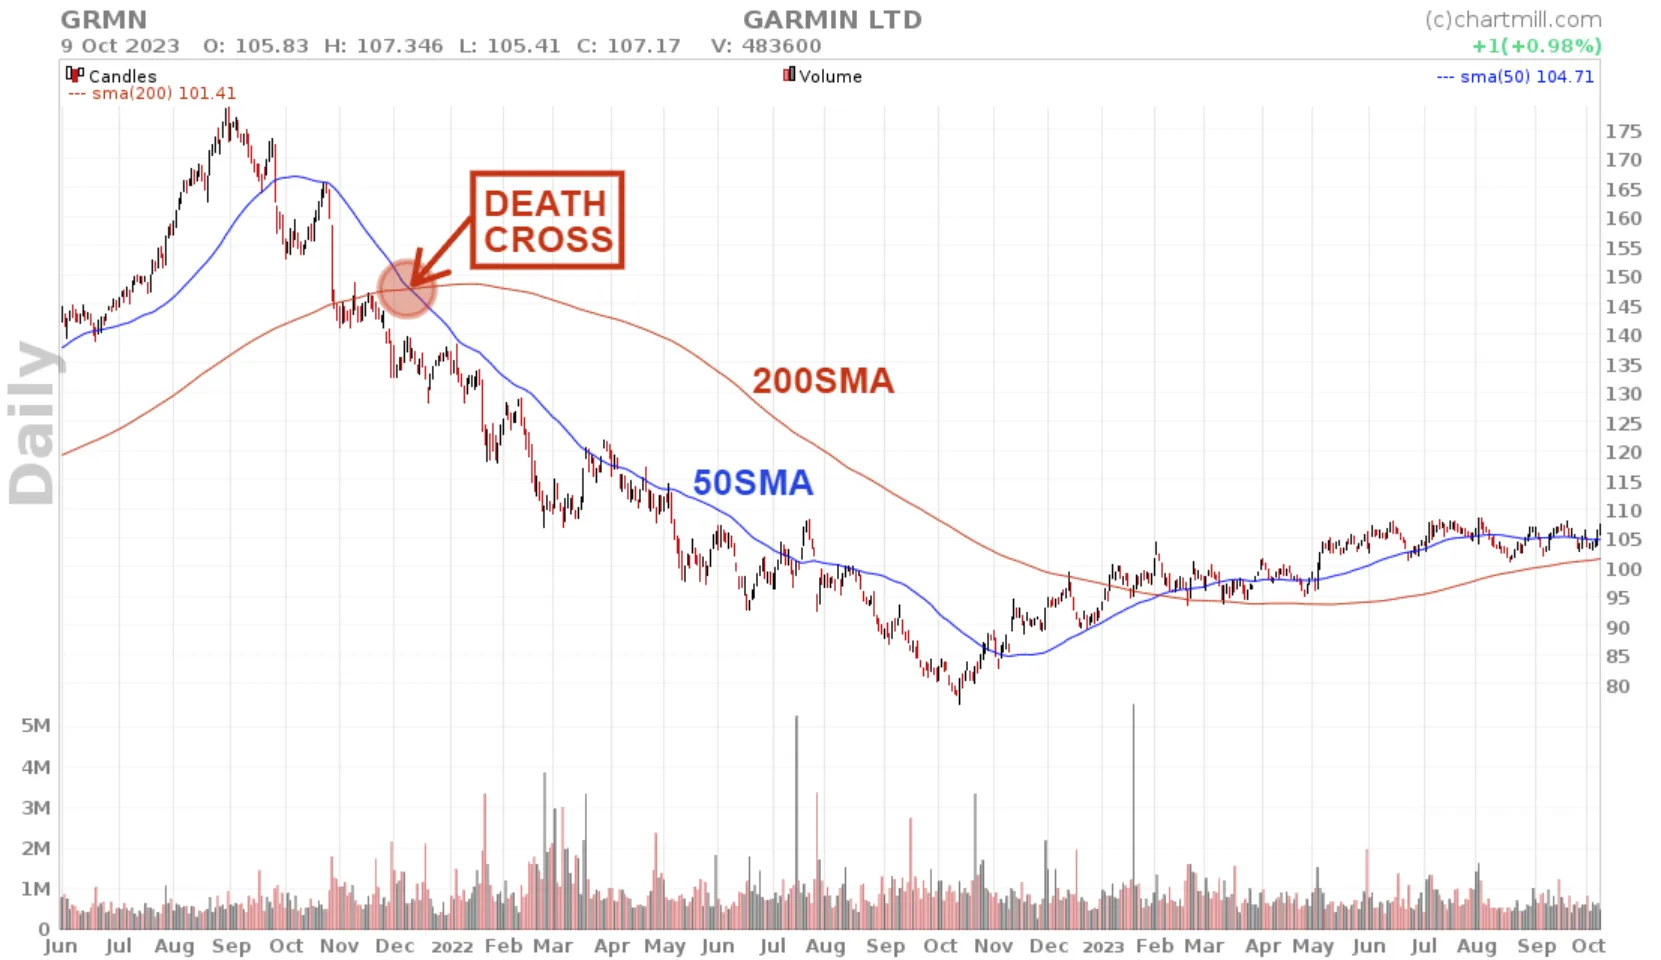
Another example of the Death Cross pattern can be seen in Garmin shares on date of 09/12/2021. The price then closed at $135.36. It bottomed on 13/10/2022, down more than 40% from its previous high.
Death Cross Chart Formation: Start To Finish
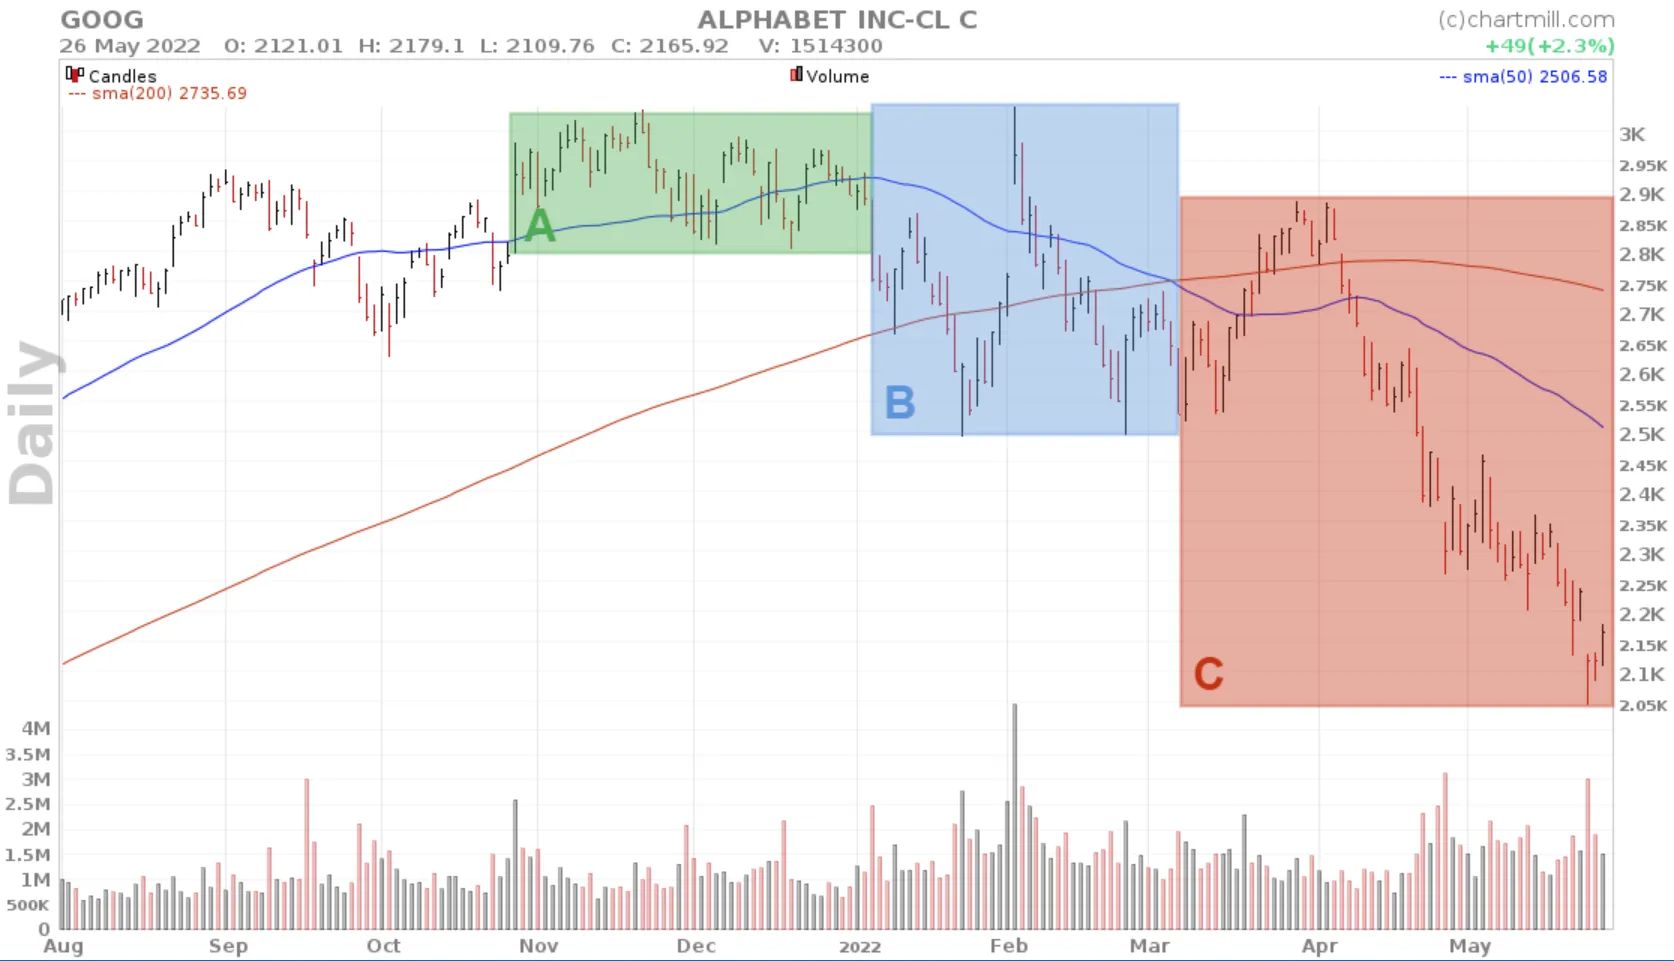
The formation of a death cross roughly occurs in a number of successive stages:
-
A: There is peak formation in the price. The short-term trend is still bullish but the price movement begins to become somewhat more erratic. Several intermediate tops follow each other more quickly and a sideways price range is formed where the price moves up and down.
-
B: The price eventually drops below the sideways price channel with the 50MA curling downwards. This phase is further characterized by an increase in volatility. Those who own the shares hesitate to secure profits and on the other hand, there are also buyers who take advantage of the initial decline to buy shares, especially when the price flirts with the 200SMA.
-
C: In this phase, the price usually notes below the SMA200 and the 50SMA crosses the 200MA downwards. This is a double confirmation that the bullish trend has ended - at least temporarily. More often than not, you will still see one or two attempts to turn the tide, but usually with too little volume to be significant. However, the decline does show increased volume. Eventually, both the 50SMA and the 200SMA fall and successive lower tops and bottoms occur below both averages.
Trading The Death Cross Signal?
Unlike the Golden Cross, which had very good results in a backtest on the S&P500 since 1960 against a buy-and-hold strategy, the result of the Death Cross backtest is much less impressive.
As an indicator, the pattern has some value in the short term (less than 30 days) but over longer periods the results point rather in the direction of the long-term returns achieved with equities.
The reason for this is the upward drift in equity markets that causes stocks to rise much more than they decline over the long term.
The term "upward drift" means that over long periods of time, the economy tends to show a growth trend because of rising company profits and increased production. Furthermore, innovations and technological advances result in new markets that further fuel the economy. Interest rates and inflation also have their role in the existing upward drift.
Moreover, research by Fundstrat shows that for the S&P500, one year after the formation of a death cross, the stock price is higher in about 66% of cases, with an average gain of 6.3% during that period.
Confirmation and Sample Selection Bias
That the pattern is considered reliable by many investors and that it does make accurate predictions is due to the fact that the most severe bear markets of 1929, 1938, 1974 and 2008 were all preceded by a death star pattern.
But this too easily overlooks the fact that there were many other death star patterns that did not result in violent and/or prolonged price declines.
Two biases are at work here. First, there is a "Sample Selection Bias" due to incorrect or incomplete sample selection. In that case, only data after which there was indeed a bear market is retained. However, this is not representative and inevitably leads to incomplete or even incorrect conclusions.
The second error involves the "Confirmation Bias",a cognitive thinking error in which people unconsciously tend to seek, remember and interpret information only in a way that confirms their existing beliefs.
In other words, people tend to selectively seek information that is in line with what they already believe, while ignoring or minimizing information that contradicts their beliefs. Thus, again, only the signals that confirm the proposition are considered while all other Death Cross signals are ignored.
It may be clear that the Death Star pattern should not simply be interpreted as a valid sell signal for the long-term.
FAQ
What’s The Difference Between A Golden Cross vs Death Cross?
Both use the 50-day short-term average and the 200-day long-term average. A Golden Cross means the 50SMA crosses the 200SMA upward, which is considered a bullish signal. A Death Cross implies that the 50SMA crosses the 200SMA downward, which is a bearish indication.
What Is The Best Timeframe For A Death Cross?
Typically, the 50SMA and 200SMA are plotted as short-term and long-term averages on a daily chart.
You are probably also interested in these articles
Stock Market Golden Cross
This represents a critical technical analysis pattern that occurs when two essential moving averages converge, signifying a potential shift in the market's direction. Read more...
How to scan for the Golden Cross or Death Cross?
In this article, we go over the screen options for filtering stocks based on the appearance of a Golden or Death Cross. Read more...
How to Enter the Market after a Golden Cross Signal? An Example of a Buy Setup
Keeping an eye on the price action after the signal and waiting for a price correction in the new trend creates great opportunities where you can enter the market with relatively little risk. Read more...
The golden cross and death cross explained (Video)

Using The 200 Simple Moving Average - 200 SMA
The 200-day moving average is used by both technical and fundamental investors to obtain insight into the long-term price trend of the stock/etf/index. Read more...
Exploring The Best Moving Averages For Swing Trading Success
Traders or investors employ various tools and indicators to make decisions regarding entry and exit points. One such tool that plays a crucial role in swing trading is the moving average. Read more...