Swing Trading with Heikin Ashi: Trend Recognition and Trading Strategy
By Kristoff De Turck - reviewed by Aldwin Keppens
Last update: Apr 23, 2024
Candlestick charts are undoubtedly one of the most popular chart forms among investors. They are originally Japanese and just because of their specific shape (body with top and bottom 'tails') they offer more information and insight than the classic line chart or barchart.
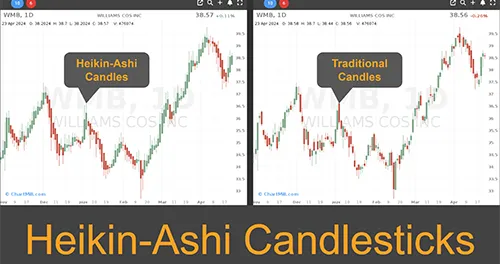
A variant of the regular candlesticks are the Heikin Ashi candlestick patterns. Just as with a regular candlestick chart, as long as the price is rising, the HA-candlesticks are shown in green. If the price drops, these candlesticks are red in color. So these are very similar in appearance to the traditional candlesticks but they differ in the way each candle is calculated.
Calculating the 'Average Candlestick'
This calculation is based on averages, i.e. the average of the opening price, the closing price, the highest price and the lowest price of the previous trading sessions. Hence the name, Heikin Ashi is Japanese for 'average candlestick'.
The calculation for each of these values is done as follows:
-
Opening Price = (Opening Price (-1) + Closing Price (-1) / 2
-
Closing price = (Opening price (0) + highest price (0) + closing price (0) + lowest price (0)) / 4
-
Highest price = highest value of (highest price (0), opening price (0), closing price (0))
-
Lowest price = lowest value of (lowest price (0), opening price (0), closing price (0))
Heikin Ashi versus regular Japanese candlestick
The major difference between Heikin Ashi and Japanese candlesticks is the way the candles are formed during the trading session.
To form a plain bullish (green) Japanese candlestick, the closing price must be higher than the opening price. With Heikin Ashi candlesticks, an upward candle is formed only when the price is above the midpoint of the previous candle.
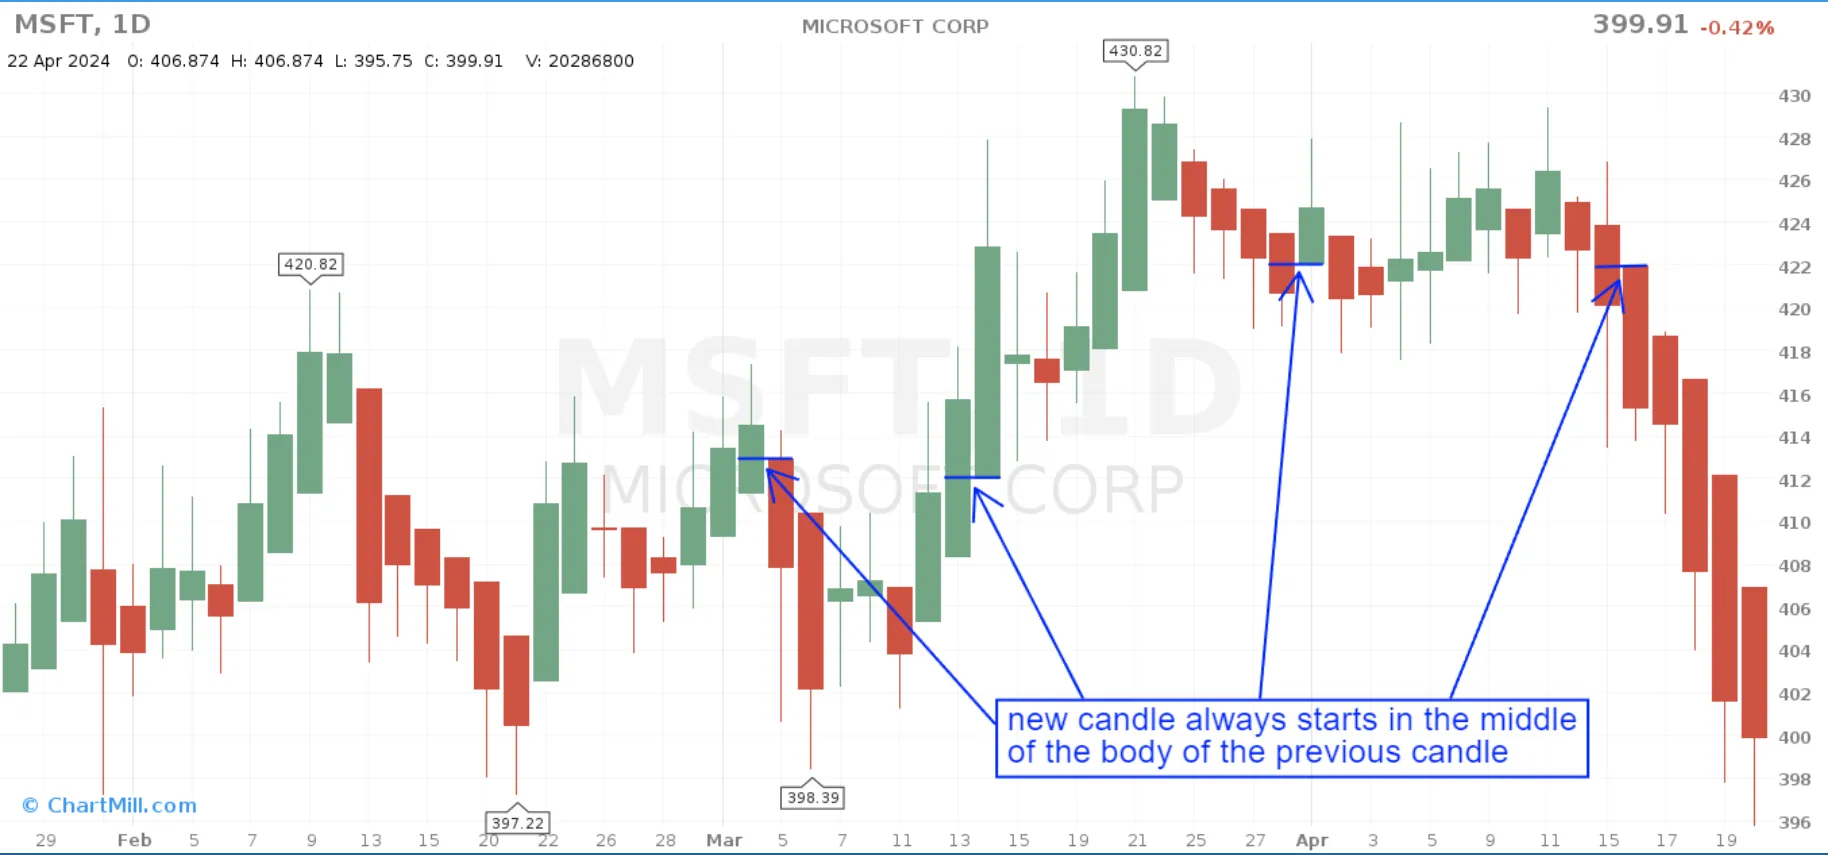
Heikin Ashi candlesticks are all related because the open price of each candle is determined based on the open and closing price of the previous candle. The highest and lowest price of each candle is also based on the information of the previous candle.
This means that Heikin Ashi candlesticks reflect price evolution more slowly than ordinary Japanese candlesticks.
Attention, precisely because the calculation uses average values, you must bear in mind that, with HA candlesticks, the last price shown does not correspond to the actual price at which the stock is currently trading! For this reason, these types of candlesticks are especially useful for trend recognition but are less suitable for deriving actual buy and sell signals from them.
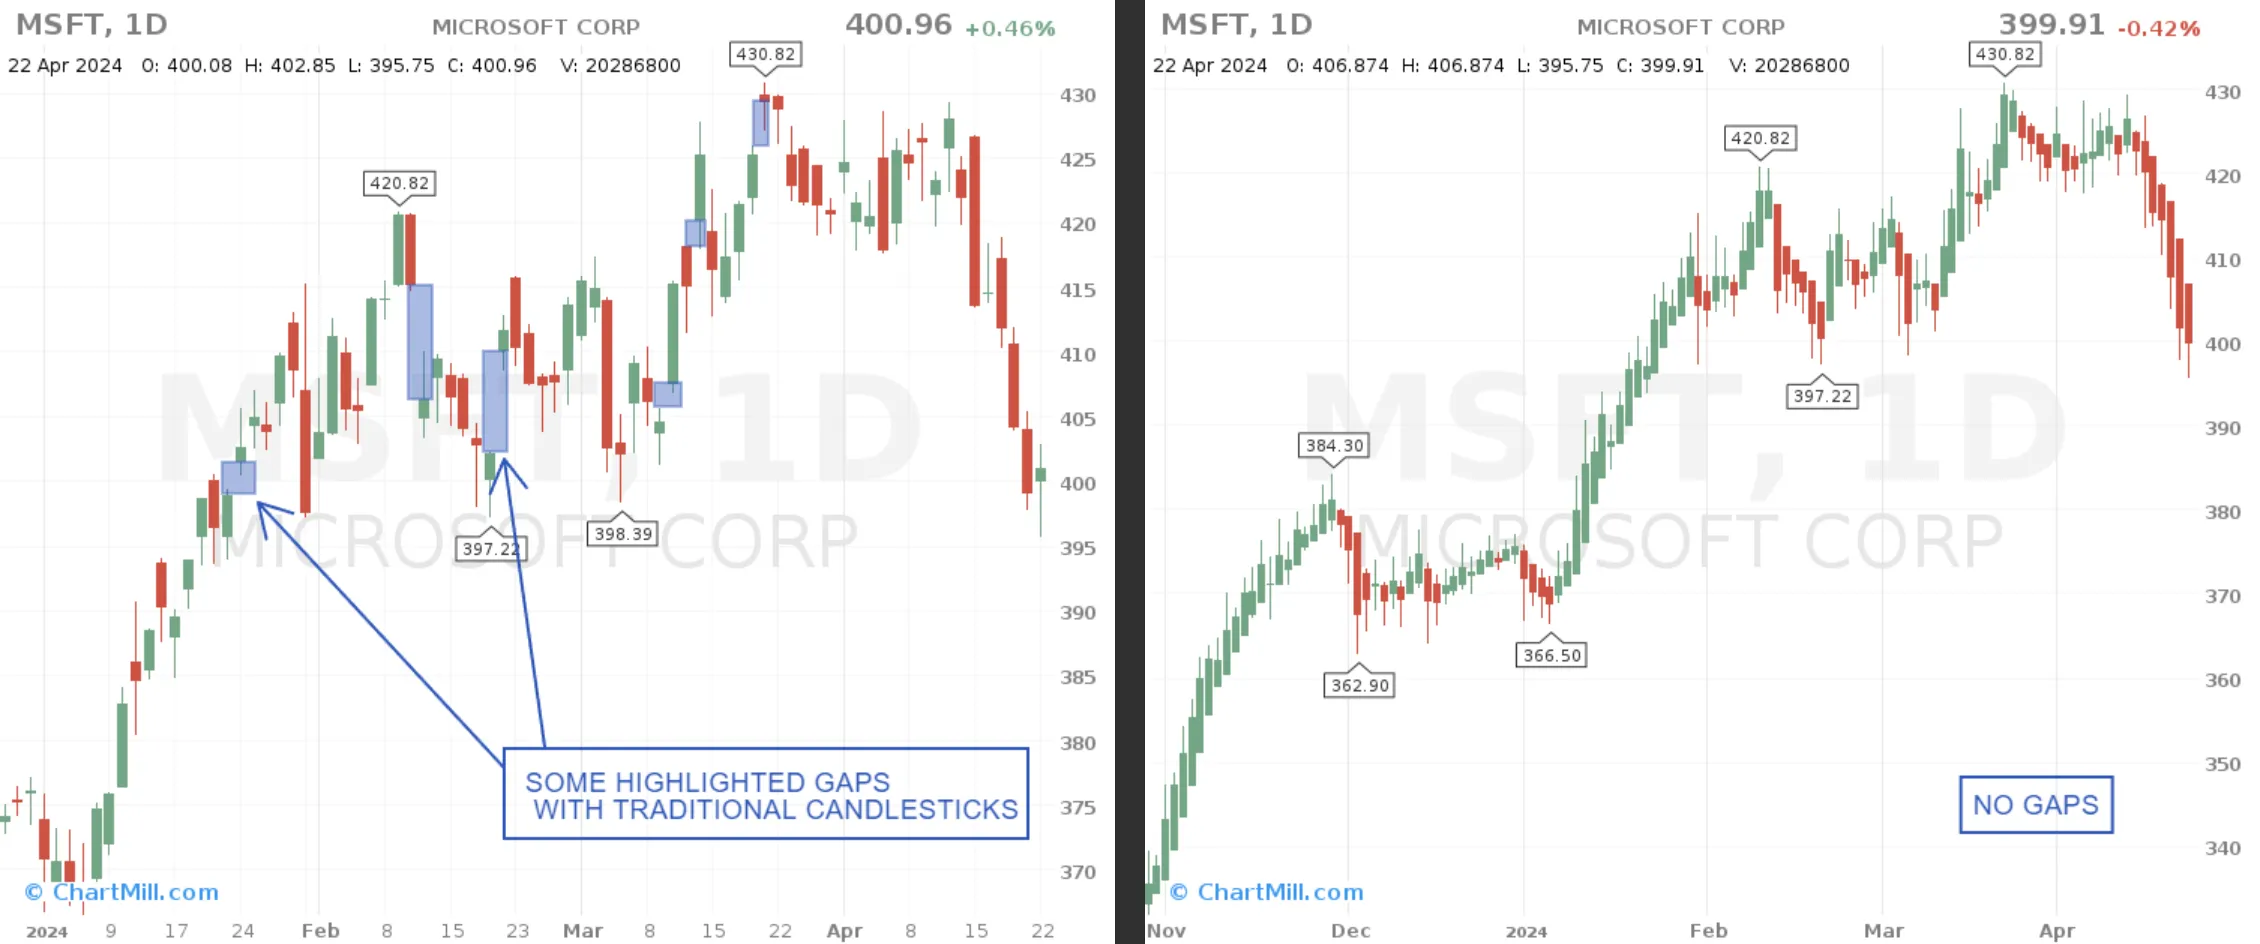
What about Gaps?
By averaging prices, Heikin-Ashi candles eliminate the gaps and spikes that do show up in traditional candlestick patterns. Whether you experience this as a positive or negative aspect is purely personal. In terms of trend recognition, gaps offer little or no added value, but they do offer insight into the strength and momentum of a specific price movement.
WHEN (not) to use Heikin Ashi candlesticks?
If you are using a trend strategy, it's certainly worthwhile to study this alternative candlestick type. Because the calculation happens on the basis of averages, with this kind of candlestick it's a lot easier to recognize the current price trend on a chart, regardless of the timeframe.
The main disadvantage of Heikin-Ashi is that the exact price is not shown. However, this is usually not a problem for swing traders who hold a position for several days to weeks and use this type of candlestick mainly to open positions in the direction of the existing trend.
However, those who trade intraday will quickly find that these types of candlesticks lack accuracy because they do not reflect the most current price.
HOW to interpret HA candlestick patterns and use them in a trading strategy?
There are several visual elements that give us valuable information about the trend.
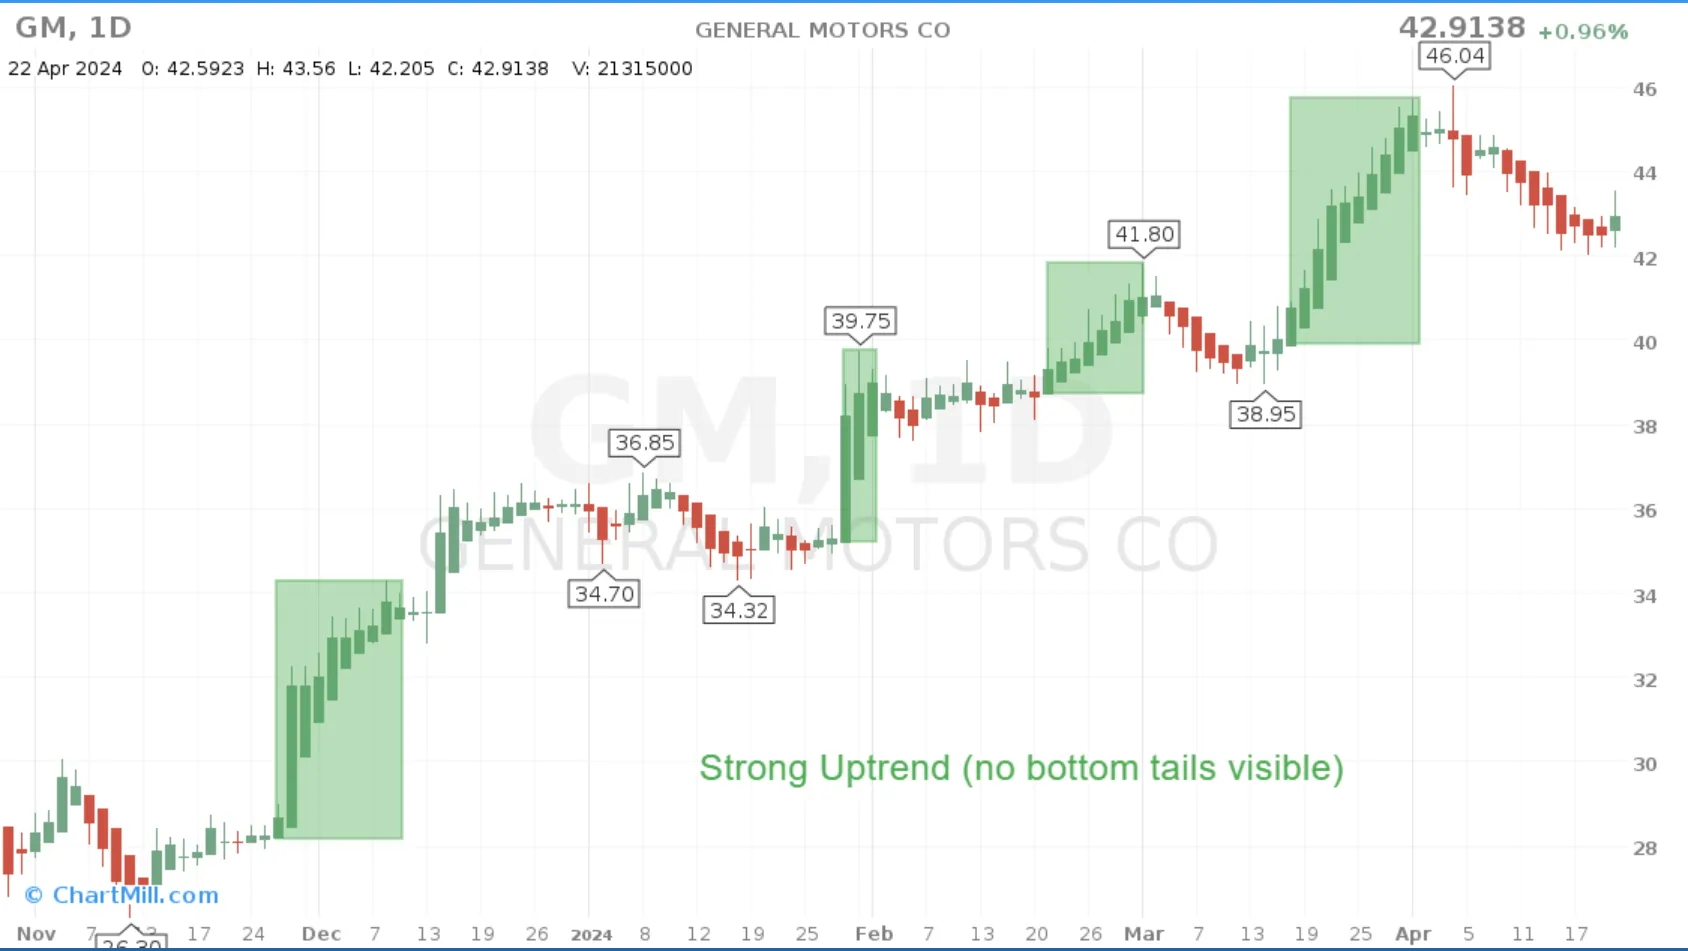
A strong uptrend can be recognized by a succession of HA-candles with relatively large bodies in the same green color with hardly any shadows at the bottom of the body. The opposite is true of a downtrend. In that case, the successive candles will be red in color with few shadows at the top of each body.
When in an uptrend the green HA candlesticks begin to show a smaller body and shadows are clearly visible both above and below the body, these are the first indications of selling pressure. This may indicate a potential trend change in the price trend.
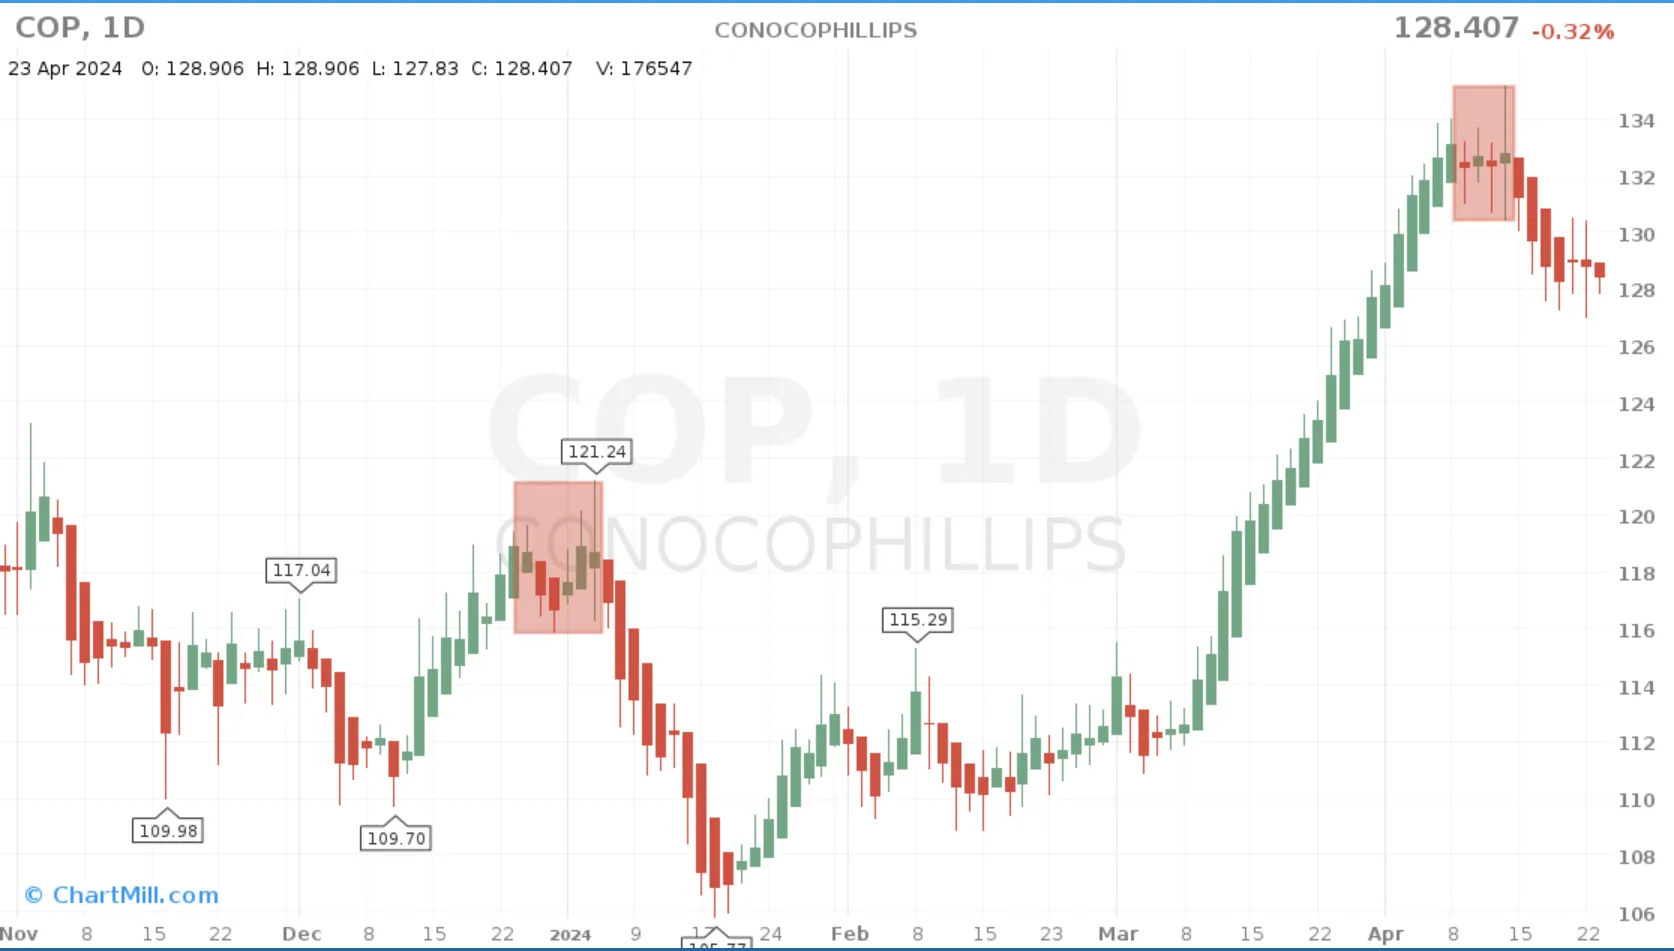
Of course, this is not a certainty. It may just as well move sideways for a while before continuing in the direction of the main trend. But it does urge traders to be cautious. Open long positions can be managed a little tighter by selling part of them or placing stops a little shorter so that a larger chunk of profit is protected.
Conclusion
Heikin Ashi candles offer interesting opportunities for swing and position traders because they are especially useful in determining the leading trend direction on the higher timeframes. However, they are not suitable for intraday trading or specific short-term momentum strategies because of their specific method of calculation. It does not reflect the most current price information.