Bearish Engulfing Pattern in Weak Stocks
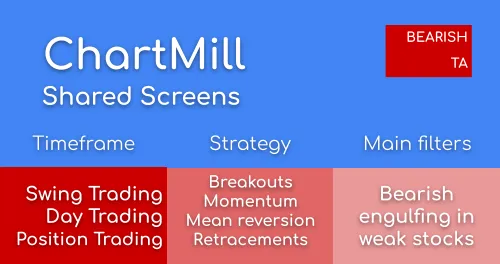
Weak performing stocks (low relative strength) that show a bearish engulfing pattern
The Bearish Engulfing Pattern | Trading Strategy and Screening
How to trade the Bearish Engulfing Pattern?
The Bearish Engulfing Pattern | Definition
Understanding the Bearish Engulfing Pattern
Related Videos
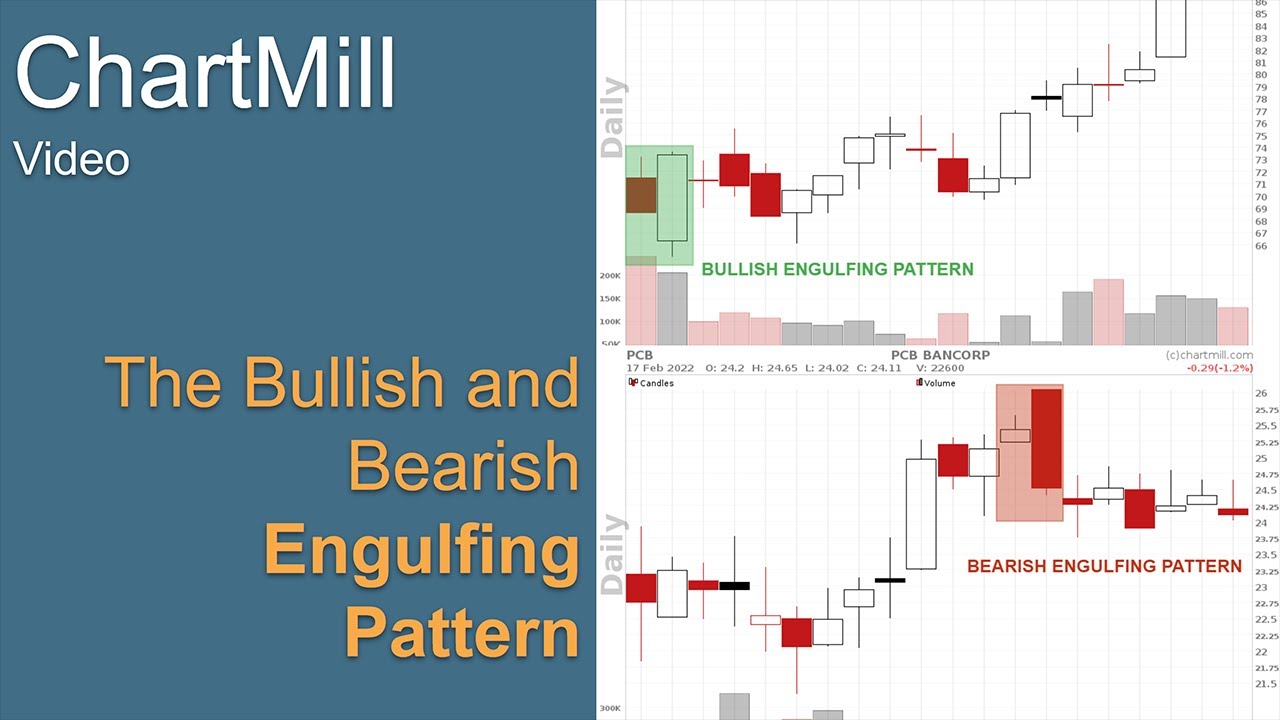
How to Trade Bullish and Bearish Engulfing Patterns?
A short video on how to use the bullish and bearish engulfing candlestick signals to find reversal patterns in any price chart.
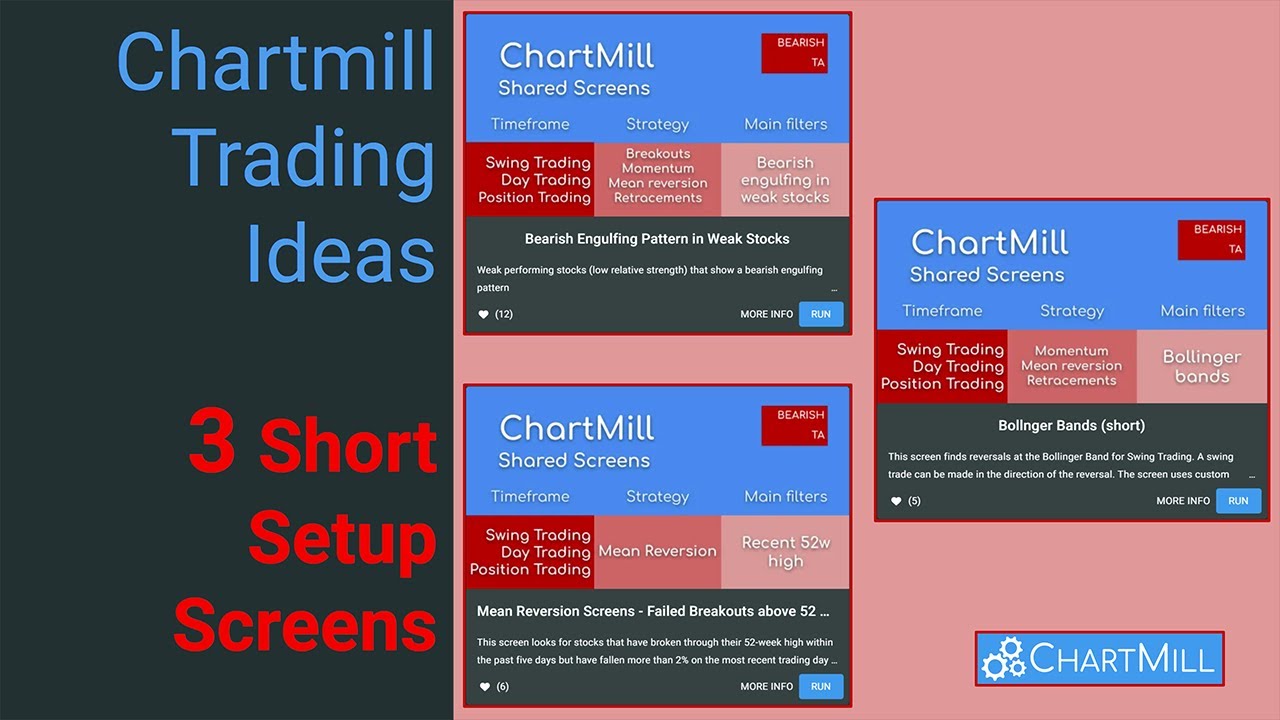
3 ChartMill Trading Ideas To Find Decent Short Setups
In this video, I share 3 ChartMill Trading Ideas to find good short setups. Please note that this is in no way a recommendation to sell stocks short.
Candlestick: Bearish Engulfing
The actual Bearish Engulfing signal
CRS<=50
Relative strength below 50, the stock has underperformed at least 50% of all other stocks in the database
Average Volume: 50 SMA > 200K
This filter excludes all stocks that have a lower daily average volume than 200K.
Price: Above 5
This filter excludes all stocks that are trading below 5 dollar.
10SMA and 20SMA
Regional Run
Run this screen in your favorite region. You can always further fine tune the screen by changing the general settings after it opened in the screener.