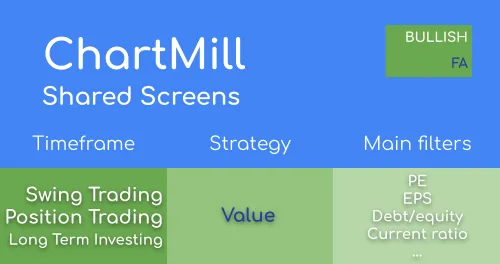
Valuation Screens - Decent Value Stocks
Which Stocks to Pick when Inflation is Rising?
Which stocks to buy when inflation is rising strongly?
Fundamental Valuation Filters
A description of the fundamental filters related to valuation, like price/earnings, price/book, peg ratio
How to find the best value stocks?
Using our stock screener to find the best value stocks
What is Value Investing?
Simply put, the value investor specifically looks for companies whose market value (stock price) is lower than their current intrinsic value.
Related Videos
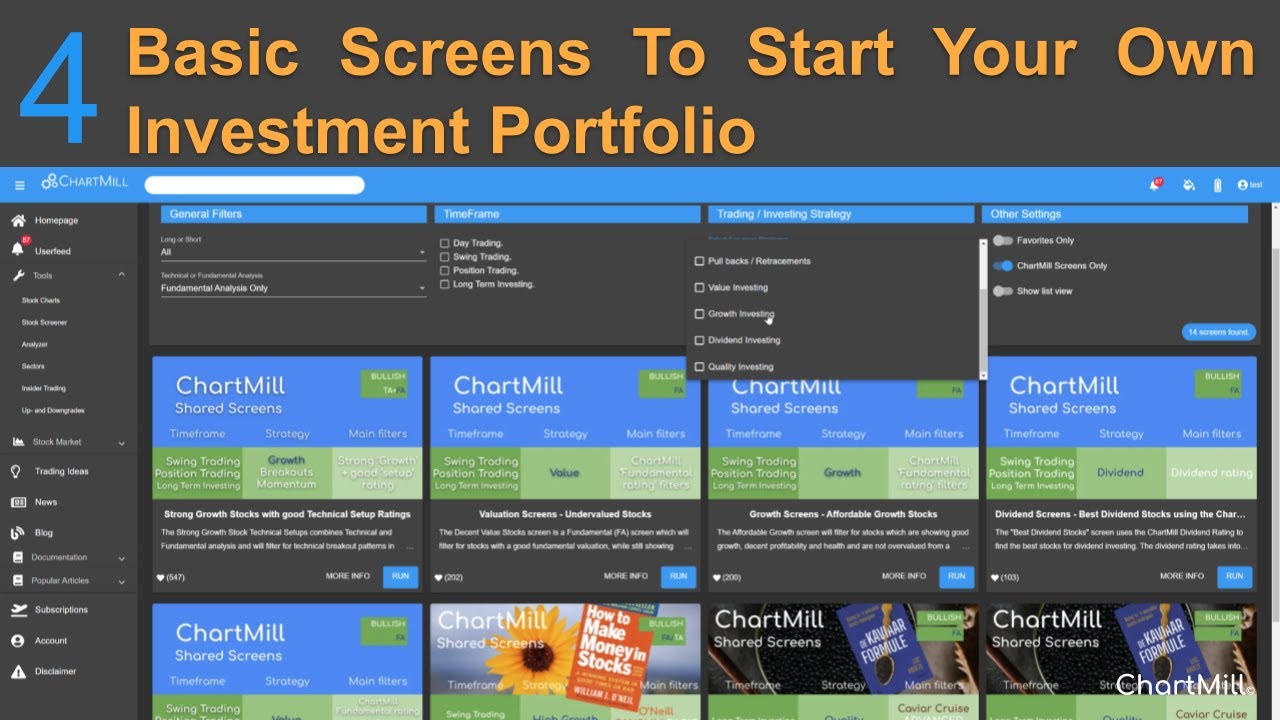
4 basic fundamental screens that will boost your search for the best stocks.
Investors come in different styles and sizes. In this article we take a look at four different fundamental screens that can serve as a basis for building your own investment portfolio with ChartMill. I'll explain what each style entails and what basic filters you can use in ChartMill to get a first basic selection.
How to find high quality VALUE stocks?
In this video, I use the stock screener to arrive at a basic list of high-quality value stocks of interest to value investors.
EPS 5Y>=5%
If profits can be increased over several years, it is a good indication that it is a safe company which reduces your risk.
Debt/Equity<=1.4
Debt / equity is used to determine the level of debt of a company. The total debt is compared with equity to understand the extent to which debt is used as a leverage to finance a company. Too much debt constitutes a risk in more volatile times if a company can no longer meet its obligations.
Dividend Yield>=1%
Companies that pay dividends will generally be considered to be on a more stable growth path.
PE<=17
The lower the Price to Earnings ratio, the cheaper the company and the more likely it is that the company in question is undervalued.
Current Ratio>=1.6
The current ratio measures the extent to which a company is able to meet its short-term financial obligations that fall due within one year (current liabilities)?
EPS Next Y>=5%
The same percentage is used as an outlook for the next year.
To properly compare results, it is best to use a custom table view (more info in the article and video).
Regional Run
Run this screen in your favorite region. You can always further fine tune the screen by changing the general settings after it opened in the screener.