Bollinger Bands
This screen finds reversals at the Bollinger Band for Swing Trading. A swing trade can be made in the direction of the reversal. The screen uses custom expressions to determine the reversal condition at the Bollinger Band.

Navigating the Volatility: Bollinger Bands Explained
Bollinger Bands® is a dynamic indicator designed to measure volatility. It consists of three lines. A middle, upper, and lower band. The middle band is a simple moving average (SMA), set at 20 periods by default. The outer lines are standard deviations, representing the degree of price dispersion around that middle band.
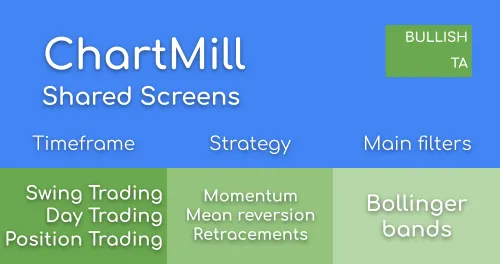
Bollinger Bands Screener
The Bollinger Bands are used to measure the volatility of a stock. in this article we will have a look at the different screen options in ChartMill
Related Videos
A Mean Reversion Swing Trading Strategy using Bollinger Bands
A highly effective ChartMill filterscreen to find low risk/high reward long- and short setups, using the Bollinger Bands indicator. This screen can be used on different timeframes.

5 momentum screening ideas using ChartMill
In this video I’ll be covering 5 predefined momentum screening ideas from our Trading Ideas' section in ChartMill. Momentum trading means that you are primarily concerned with short-term positions. The intention is to buy stocks which are already rising and to sell them again quickly as soon as the first signs are visible that the rising is losing momentum. As an investor you try to benefit from the high volatility associated with the rise in this relatively short time.
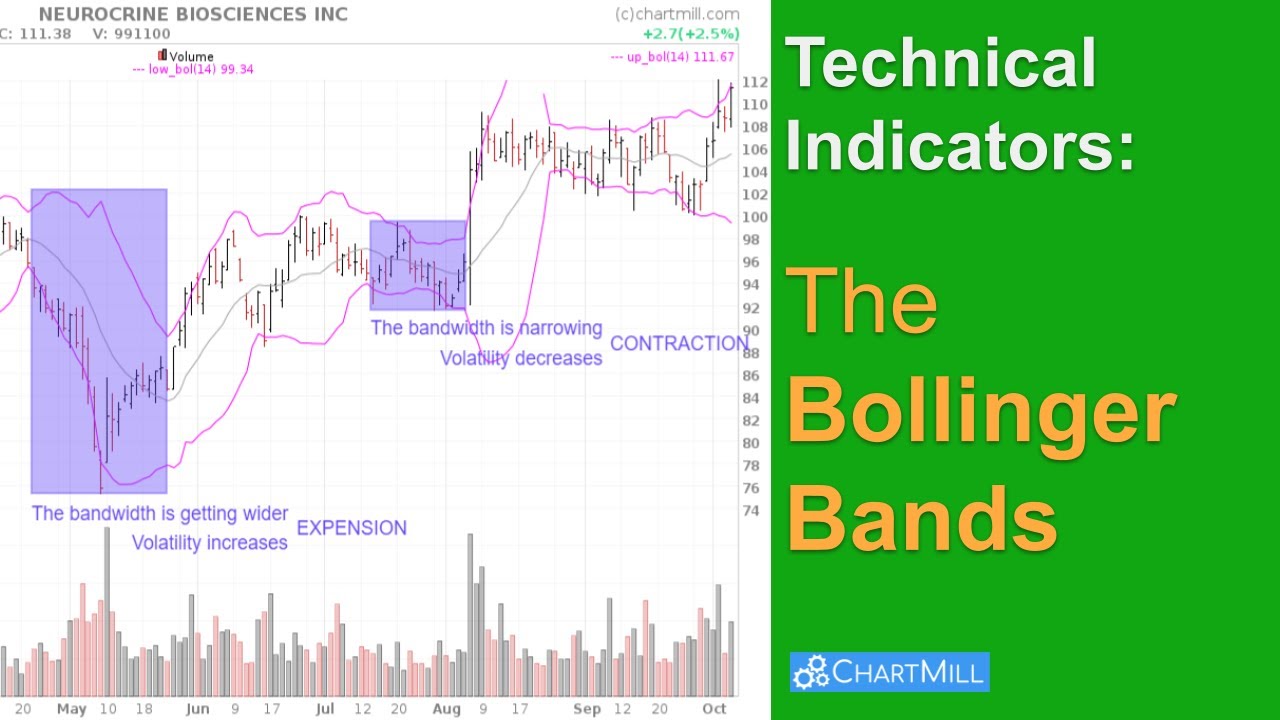
What are Bollinger Bands and how to use this indicator?
The Bollinger Bands indicator owes its popularity mainly to the fact that it can be used both for breakouts, retracements and mean reversion strategies. In this short video I explain exactly what Bollinger Bands are and how to use this indicator in different swing trading strategies. Finally, I show some of the available Bollinger Bands screening filters in ChartMill that allow you to quickly find specific swing trading setups.
(close>previousHigh)
The current price is above the high of the previous day, which means the last candle is a rising candle.
(previousClose<lowerBBand)
The close from yesterday was below the lower Bollinger Band.
ETF: No ETFs
Avoid ETFs
Average Volume: 50 SMA > 500K
Minimum Liquidity
Price VS SMA: Price Above SMA(200)
A general filter to determine the direction of the long term trend
Price: Above 5
A minimum Price to avoid low prices stocks
Exchange: US Only
Only US exchanges
Chart with Bollinger Bands Indicator
Regional Run
Run this screen in your favorite region. You can always further fine tune the screen by changing the general settings after it opened in the screener.