
Arizona Sonoran Pre-Feasibility Study Delivers Exceptional Results for the Cactus Project, Outlining Long-Life, Low-Cost Copper Production in Arizona
Provided By Business Wire
Last update: Oct 20, 2025
Arizona Sonoran Copper Company Inc. (TSX:ASCU | OTCQX:ASCUF):
This press release features multimedia. View the full release here: https://www.businesswire.com/news/home/20251020093272/en/
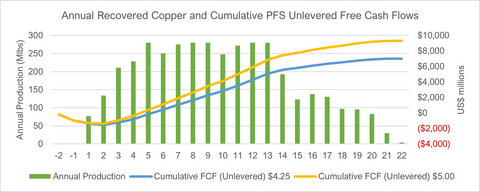
FIGURE 1: Estimated Annual Recovered Copper and Cumulative PFS Unlevered Free Cash Flows illustrates benefits of focusing on the optimized mine plan
- Simple open-pit / SXEW operation producing approximately 103,000 tonnes (226 million lbs) of estimated average annual copper cathodes over the first 10 years of mining, which would make Cactus the third largest cathode producer in the USA
- Industry-leading capital intensity of $10,894 per tonne of copper cathodes produced
- $574 million of average annual EBITDA1
- Strong economics to support the continued development of Cactus with a focus on simplicity and executability of the open-pit copper cathode project, on private land in Arizona
- Cactus Project is well positioned over the 22-year Project Life of Mine (“LoM”) to generate value at a variety of copper prices:
|
Copper Price Assumption |
Base Case $4.25/lb Cu |
COMEX Assumed Spot Pricing $5.00/lb Cu1 |
|
NPV8% (after-tax) |
$2,301 |
$3,343 |
|
IRR (after-tax) |
22.8% |
28.7% |
|
Payback (after-tax) |
5.3 years |
4.5 years |
|
Initial Capital Expenditures |
$977 million |
$977 million |
|
NPV:CAPEX Ratio |
2.4:1 |
3.4:1 |
|
LoM Gross Revenue |
$16,948 million |
$19,939 million |
|
LoM FCF (unlevered after-tax) |
$7,162 million |
$9,451 million |
- Conventional, Cost-effective Mining and Processing: Open-pit, Heap Leach and SXEW Operation with Oxide and Enriched Materials from Cactus and Parks/Salyer open pits over 22 years of processing
- Cash costs (C1)2 of $1.34/lb, All in Sustaining Costs (“AISC”) of $1.62/lb and All in Costs (“AIC”)1 of $2.01/lb
- Initial mineral reserves of 513 million tons at a grade of 0.52% Total Copper in the Proven and Probable category for 5.3 billion pounds of contained copper
- 65% conversion of leachable M&I mineral resources to mineral reserves
- Increased grades reporting to the heap leach pads
- Significant benefits to the local community and economy of Arizona, including projected creation of an estimated 600+ direct jobs
- Future mine expansion opportunities outside of the current mineable copper reserves, including late mine life primary sulphides, Cactus East and other exploration targets
- Final investment decision as early as Q4 2026 with targeted first cathodes in 2029
- Next steps with anticipated completion in 2H 2026 include:
- Definitive Feasibility Study, including detailed engineering
- Project financing process is well-underway, with Hannam & Partners supporting the advancement of discussions to secure project debt from tier-1 banks, ECAs and private lenders
- Amend currently held permits to reflect the larger size and modification to the project plan
|
_________________________ |
|
1 $5.02/lb Copper - 5-day COMEX spot average |
|
2 Non-IFRS Financial Measure. See “Non-IFRS Financial Measures” below. |
Arizona Sonoran Copper Company Inc. (TSX:ASCU | OTCQX:ASCUF) (“ASCU” or the “Company”) today announces the exceptional results from an NI 43-101 Pre-Feasibility Study on its 100%-owned brownfield Cactus Project in Pinal County, Arizona (the “PFS”). The PFS outlines a long-life, economically viable copper conventional operation utilizing open pit mining and heap leach-SXEW processing to produce LME Grade A copper cathode onsite for a meaningful contribution to refined copper supply in the U.S.A. All dollar amounts referenced herein are U.S. dollars, and all references to tons are imperial or short tons, unless otherwise noted; 1 short ton equals approximately 0.91 metric tonnes.
A webinar will be held to discuss the PFS on October 21, 2025, at 1:00 pm ET. Please join George Ogilvie, Nick Nikolakakis, Bernie Loyer, Travis Snider, Steve Dixon and Christopher White in discussion of the PFS and the Company’s next steps by registering here https://www.bigmarker.com/vid-conferences/arizona-sonoran-update.
TABLE 1: Summary of Key Metrics At $4.25/Lb Cu PFS Base Case
|
Valuation Metrics |
Unit |
|
|
NPV8% (pre-tax) |
$ millions |
3,244 |
|
NPV8% (after-tax) |
$ millions |
2,301 |
|
Internal Rate of Return (after-tax) |
% |
22.8 |
|
Payback Period (after-tax) |
# years |
5.3 |
|
LoM Revenues |
$ millions |
16,948 |
|
LoM EBITDA* |
$ millions |
11,805 |
|
LoM FCF* (unlevered) after tax |
$ millions |
7,162 |
|
Project Metrics (Imperial) Life of Mine |
|
|
|
Construction Period |
# months |
24 |
|
Operational Life of Project(1) |
# years |
22 |
|
Strip Ratio |
Waste:Feed |
3.3:1 |
|
Ore Mined |
ktons |
512,859 |
|
Copper Reserve Grade |
% CuT |
0.52 |
|
Annual Crusher Throughput |
million tons |
28 |
|
Recoveries |
% CuT |
75 |
|
Recovered Copper Cathode |
K lbs |
3,987,794 |
|
Annual Copper Production(1) |
000 tons millions lbs |
99 198 |
|
Project Years 1-10 (average annual) |
|
|
|
Copper Production
|
000 tons millions lbs |
113 226 |
|
Revenue |
$ million/yr |
962 |
|
FCF (unlevered) after-tax |
$ million/yr |
381 |
|
Costs |
|
|
|
Cash Cost (C1)* |
$/lb Cu |
1.34 |
|
All-in Sustaining Cost (AISC)* |
$/lb Cu |
1.62 |
|
All in Cost (AIC)* |
$/lb Cu |
2.01 |
|
Initial Capital (including contingency) |
$ millions |
977 |
|
Sustaining Capital |
$ millions |
1,327 |
Notes:
*Non-IFRS financial measure; see “Non-IFRS Financial Measures”. Project operating costs include mine operating, process plant operating, and general and administrative costs (“G&A”). Total production costs include royalty expense. The AISC additionally includes initial Capex, sustaining Capex, reclamation & closure. AIC additionally includes taxes and initial capital.
(1) Life-of-mine excludes years 21 and 22, during which operations consist solely of SXEW processing
Bernie Loyer, ASCU SVP Projects commented, “The work product of this recent study validates the investment of optimizing the Parks/Salyer mine plan both in terms of production cadence and ore quality. That optimization has resulted in higher grade material being placed sooner in the execution plan and produces a much more consistent copper production profile, generating superior cash flows as compared to the 2024 PEA. Building on the benefits first highlighted by the 2024 PEA, including the impact of the MainSpring land acquisition to the overall Parks/Salyer mine plan and the comprehensive available infrastructure, a solid foundation with a defined and compelling plan of operations emerges in sharp focus. That plan in combination with a supportive local community, a proven project team on deck, and the Cactus Project being fully positioned on private land, sets an impressive stage for the next step in this incredible journey to deliver a future long-term source of copper cathode produced in the USA.”
George Ogilvie, ASCU President and CEO, commented, “This PFS is a major milestone in the advancement of our lower risk open pit Cactus Project towards a final investment decision as early as Q4 2026. We believe we are developing a world-class copper cathode project, within Casa Grande’s copper district. Looking forward, Cactus is a project capable of plating an average of 103,000 tonnes of copper cathodes annually in the first 10 years of the mine, available for direct shipment into the American supply chain. We have the opportunity to become a significant player in the American copper industry, filling a clear gap in the domestic copper supply. An industry leading capital intensity of $10,894 per tonne and an NPV:CAPEX ratio of 2.4:1 sets our project apart as having highly compelling economics, with the potential to be shovel-ready towards the end of 2026. We anticipate production of first copper cathodes in 2H 2029.
I am proud of the organic project growth since our IPO in 2021, through adjacent land acquisitions and drilling, defining a significant copper deposit. Today, the land position has increased by 320% and mineral resources have grown by over 580% in the M&I category, with the after-tax NPV8 of the Cactus Project having reached a substantial $2.3 billion. Cactus is among the highest quality copper development projects globally in terms of lower risks, size, scale and capital intensity.
We now embark on three key workstreams towards a final investment decision, including a definitive feasibility study, obtaining permit amendments and project financing. Each workstream has begun and is being led by experienced team leaders. We are keen to continue advancing our standout brownfield copper asset in a tier 1 location.”
Key PFS Advancements
Operations:
- Streamlined mine plan leaches oxides and enriched ore from Parks/Salyer and Cactus West open pits, reducing LoM but improving estimated overall ore grade reporting to the processing circuit and simplifying the execution of the project
- Primary Sulphides and Cactus East underground moved to future expansion opportunities
- Optimized crushing and haulage to maximize copper recovery
- Metallurgical and recovery performance improved to 75% Total Copper recovery from 65% Total Copper, over defined leach cycle spanning three 180-day cycles
Economics:
- A focus on efficient copper operations results in consistent estimated annual revenues, free cash flows and annual production rates
- Positive FCF from between year 2 and 3
- $3.8 billion FCF1 (unlevered) over first 10 years
- Modelled at $4.25 copper price vs long-term analysts’ consensus of $4.34 and COMEX spot’s 5-day average of $5.02
Mining and Processing Costs:
- Initial mining phases moved north to access higher grade ore tons earlier at Parks/Salyer
- Crusher capacity increased to 28 million tons per annum and Solvent Extraction (“SX”) flow rate increased to 21,500 gallons per minute (“gpm”)
- Full Solvent Extraction/Electrowinning (“SXEW”) nameplate capacity increases to 140,000 tons copper per annum between years 3 and 4, facilitating a higher production profile in the early years
- Lower estimated mining cost per ton of ore and waste rock moved primarily due to economies of scale, and reduced drill and blast requirements in the overlying waste material
- Low estimated processing costs related to decreased net acid consumption (7 lbs per ton)
- Better defined power requirements, including addition of second substation and extending current lines
- Initial capital estimate supports a higher production profile in years 3-5
The Company intends to file a technical report (the “Technical Report”) in respect of the PFS in accordance with National Instrument 43-101 – Standards of Disclosure for Mineral Projects (“NI 43-101”) on SEDAR+ (www.sedarplus.ca) under the Company’s issuer profile and the Company’s website within 45 days of this press release.
Pre-feasibility Study Summary
The capital cost estimates for this PFS were developed with a -/+20% accuracy and an estimated development contingency of 18% for plant and site and 5% mining equipment, according to the Association of the Advancement of Cost Engineering International (AACE) Class 4 estimate requirements. The estimates include the cost to complete the design, engineering, procurement, construction, and commissioning of all process plant facilities. The Company expects to produce LME Grade A copper cathodes directly onsite.
The mine plan establishes onsite copper cathode production from conventional heap leach and SXEW processing of the oxide and enriched material. Mine operations are expected to use conventional truck and shovel and two-stage crushing. Truck loading of the heap leach pad in the first three years then pivoting to conventional stacking. The tank house will start with a 70,000 ton per year facility with the addition of a second facility of same size, ready for use between years three and four. Production from the heap will reach 140,000 tons per year from year five. Average annual cathode production for the first 10 years is expected to be 113,000 tons. A total of 2,210 million tons is expected to be mined (waste + ore), including a total of 513 million tons processed, resulting in the recovery of 3,988 million pounds or 1,994,000 tons of copper cathodes over the LoM.
Feed to the heap leach pad will be oxide and enriched ore from the Parks/Salyer and Cactus West open pits.
TABLE 2: PFS Sensitivities to the Copper Price
|
Revenue, NPV8% and IRR Sensitivity Based on Copper Price |
|||||
|
Metal Price |
Copper Price |
Revenue (US$000) |
Pre-tax NPV8% (US$000) |
After-tax NPV8% (US$000) |
After-tax IRR (%) |
|
Base Case(1) |
$4.25 |
$16,948,123 |
$3,243,942 |
$2,301,317 |
22.8% |
|
20%(2) |
$5.10 |
$20,337,747 |
$4,741,010 |
$3,480,922 |
29.4% |
|
10% |
$4.68 |
$18,642,935 |
$3,992,476 |
$2,892,400 |
26.2% |
|
-10% |
$3.83 |
$15,253,310 |
$2,495,409 |
$1,709,602 |
19.2% |
|
-20% |
$3.40 |
$13,558,498 |
$1,746,875 |
$1,112,191 |
15.5% |
(1) No COMEX premium applied to the Base Case study
(2) COMEX Spot pricing assumed at $5.00
Conventional Mining and Processing Operations
For the PFS, the basis of the design for material handling equipment is forecasted at an annual operating throughput of 28,000,000 dry tons of ore per year placed on the heap leach pad. The Parks/Salyer and Cactus West open pits will provide ore feed to the leach pad from year 1 through year 20 at variable rates not less than an estimated 18 million tons and not more than 28 million tons per annum. Crushing rates are variable to accommodate constraints in the electrowinning circuit and avoid building large inventories on the leach pad. The mining sequence has been designed to balance stripping requirements under this constraint for efficient plant operations.
The Cactus Project process plant will consist of a two-stage crushing and screening plant ahead of heap leach. The pregnant leach solution (PLS) will be processed in a solvent extraction (SX) and electrowinning (EW) plant. The SXEW plant process design will include three extraction settlers, one strip settler, a tank house, and initial electrowinning cathode capacity of 70,000 tons per year followed by an expansion that would double capacity to 140,000 tons per year between years three and four.
A total of 1,839.6 million tons of material is projected to be mined from the Parks/Salyer pit, including 373.8 million tons of proven and probable mineral reserve leach ore at a 0.59% total copper grade and a strip ratio of 3.9:1. A total of 368.9 Mt of material is projected to be mined from the Cactus West pit, including 139.1 Mt of proven and probable mineral reserve leach ore at a 0.33% total copper grade and a strip ratio of 1.7:1. The LoM strip ratio is 3.3:1 combined.
The Parks/Salyer open pit is planned to be mined in seven phases (0-6), while the Cactus West open pit is planned to be mined in two phases (1-2). The detailed designs for the Parks/Salyer and Cactus West open pits are based on wall slope parameters received from Call and Nicholas Inc. (CNI) in June 2025. Equipment sizing for ramps and working benches are based on the use of 320-ton rigid frame trucks. The road width design is 140 feet (42.6 m) with a maximum ramp gradient of 10%. Working benches are designed at 40 feet (12.2 m) with placement of safety berms of variable width on every bench. Geotechnical berms of varying width will be used in places to reduce overall slope angles in Parks/Salyer to approximately 40 degrees, when this is not accomplished with ramp widths alone.
Copper cathodes will be produced directly onsite via heap leach and SXEW, including a three-year ramp up period. The Cactus heap leaching process design includes crushing of all material types to a minus 3/4” P80 size for leaching. All material types will be leached on a single pad with an initial leaching cycle of 180 days. Three 180-day leach cycles have been assumed over a three-year period, as the practical limit for effective recovery based on experience and hydrodynamic analysis of the materials by HydroGeoSense, an independent consultant. Gross acid usage is estimated to be 18.5 lbs per ton and net acid usage of 7.0 pounds per ton at a cost of $160 per ton.
A 95% heap efficiency factor has been applied to relate column tests to operational heap copper extractions. This allows for inefficiencies in the heap operations. The recommended copper recovery projections include this heap efficiency factor.
In an effort to focus on higher quality ore tons, the existing Stockpile has been removed from the mine plan and will be screened for use of over liner on the leach pads. Cactus East and primary sulphides, excepting those extracted while targeting oxides and enriched materials, have also been removed from the mine plan, in favour of future optimization opportunities.
Average annual water consumption is planned at approximately 2,050 gallons per minute, the equivalent of 3,300 acre feet per year, well within ASCU’s permitted 3,736 acre feet per year industrial use allocation, using in-place onsite wells.
Costs and Economics
The estimated total LoM costs, operating costs per ton ($/ton) of processed material, and dollars per pound ($/lb) of cathode produced are summarized in the three tables below. Project operating costs include mine operating, process plant operating, and general and administrative costs (“G&A”). Total production costs include the royalty expense. The AISC additionally includes sustaining capital expenditures, reclamation & closure, while AIC further includes initial capital expenditures, property and severance taxes.
Mining operating cost estimates, prepared by AGP Mining Consultants Inc., are based on Company-managed mining activities using an owner-operator model. Process operating cost estimates were prepared by M3 Engineering and G&A cost estimates were prepared by M3 Engineering with input from ASCU, as summarized in TABLES 3-5 below (note numbers may not add due to rounding). Sequence of operations and annual cash flow estimates are detailed in Exhibit 1 and 2, at the end of this press release.
TABLE 3: LoM Operating and Production Costs Estimates
|
TABLE 3: LoM OPERATING AND PRODUCTION COSTS |
||||
|
Cost Elements |
LoM (US$) |
|||
|
Total Cost (US$M) |
US$ / ton Processed |
US$ / tonne Processed |
US$ / lb Copper |
|
|
Mine Operating Cost |
$3,518 |
$6.86 |
$7.56 |
$0.88 |
|
Process Plant Operating Cost |
$1,297 |
$2.53 |
$2.79 |
$0.33 |
|
General & Administration |
$205 |
$0.40 |
$0.44 |
$0.05 |
|
Operating Costs |
$5,021 |
$9.79 |
$10.79 |
$1.26 |
|
Royalties |
$324 |
$0.63 |
$0.70 |
$0.08 |
|
Total Production Costs (C1)1 |
$5,344 |
$10.42 |
$11.49 |
$1.34 |
|
Sustaining Capex |
$1,327 |
$2.59 |
$2.85 |
$0.33 |
|
Reclamation & Closure |
$25 |
$0.05 |
$0.05 |
$0.01 |
|
Salvage |
($226) |
($0.44) |
($0.49) |
($0.06) |
|
All-In Sustaining Costs1 |
$6,471 |
$12.62 |
$13.91 |
$1.62 |
|
Property & Severance Taxes |
$579 |
$1.13 |
$1.25 |
$0.15 |
|
Initial Capex (non-sustaining) |
$977 |
$1.90 |
$2.10 |
$0.24 |
|
All-In Costs1 |
$8,027 |
$15.65 |
$17.25 |
$2.01 |
TABLE 4: LoM Operating Cost and Cash Flow Estimates
|
TABLE 4: LoM OPERATING COST AND CASH FLOW |
||
|
ACTIVITY |
US$M |
US$ / ton Processed |
|
LOM REVENUE |
16,948 |
- |
|
Mining |
3,518 |
6.86 |
|
Process Plant |
1,297 |
2.53 |
|
General & Administration |
205 |
0.40 |
|
Total Cash Operating Cost |
5,021 |
9.79 |
|
Royalties |
324 |
0.63 |
|
Salvage Value |
(226) |
(0.44) |
|
Reclamation & Closure |
25 |
0.05 |
|
Total Production Cost |
5,144 |
10.03 |
|
EBITDA |
11,805 |
- |
|
Total CAPEX1 |
2,304 |
4.49 |
|
Net Income Before Taxes |
9,500 |
- |
|
Taxes |
2,338 |
4.56 |
|
After-tax free Cash Flow (unlevered) |
7,162 |
- |
TABLE 5: Capital Cost Estimates
|
TABLE 5: CAPITAL COST ESTIMATES |
||||
|
AREA |
DETAIL |
INITIAL CAPEX (US$000’s) |
SUSTAINING CAPEX (US$000’s) |
TOTAL CAPEX (US$000’s) |
|
Direct Costs |
Mine Costs |
224,294 |
546,407 |
770,701 |
|
Process Plant |
335,651 |
532,958 |
868,609 |
|
|
Infrastructure |
123,425 |
36,275 |
159,700 |
|
|
Indirect Costs |
149,676 |
44,891 |
194,567 |
|
|
Owner's Costs |
24,137 |
- |
24,137 |
|
|
Land |
10,000 |
82,152 |
92,152 |
|
|
Total CAPEX without Contingency |
867,183 |
1,242,683 |
2,109,866 |
|
|
Contingency |
109,794 |
84,605 |
194,399 |
|
|
Total CAPEX with Contingency |
976,977 |
1,327,288 |
2,304,265 |
|
Geology
The Cactus Project is host to a large porphyry copper system that has been dismembered and displaced by Tertiary extensional faulting. The major host rocks are Precambrian Oracle Granite and Laramide monzonite porphyry and quartz monzonite porphyry. The mine trend features the formation of horst and graben blocks of mineralization where the Cactus deposits are situated, extending from the Cactus East deposit, southwest to the Parks/Salyer deposit. Drilling to the northeast and southwest along the trend indicates that mineralization continues in both directions and at depth at the Cactus West deposit.
Mineral reserve estimates are derived from the Measured and Indicated mineral resource estimate (MRE) prepared by ALS Geo Resources (see Company’s press release dated SEPT 16, 2025). Measured and Indicated mineral resources were converted to Proven and Probable mineral reserves based on design guidelines and applicable modifying factors and are shown in TABLE 6, TABLE 7, and illustrated in FIGURE 4 below. For more details relating to the 2025 mineral resource estimate, please refer to the press release dated September 16, 2025, a copy of which is available on SEDAR+ (www.sedarplus.ca) under the Company’s issuer profile and the Company’s website (www.arizonasonoran.com).
TABLE 6: Cactus Project Mineral Reserve Estimates
|
Material Type |
Tons kt |
Grade CuT % |
Grade Cu Tsol % |
Contained Total Cu (k lbs) |
Contained Cu Tsol (k lbs) |
Contained Total Cu Short Tons |
Contained Total Cu Tonnes |
|
Proven |
|||||||
|
Cactus West Open Pit |
21,201 |
0.30 |
0.19 |
129,158 |
81,327 |
64,579 |
58,585 |
|
Parks/Salyer Open Pit |
43,055 |
1.03 |
0.87 |
890,055 |
747,217 |
445,028 |
403,723 |
|
Total Proven |
64,256 |
0.79 |
0.64 |
1,019,213 |
828,544 |
509,606 |
462,308 |
|
Probable |
|||||||
|
Cactus West Open Pit |
117,903 |
0.33 |
0.20 |
778,312 |
475,530 |
389,156 |
353,037 |
|
Parks/Salyer Open Pit |
330,700 |
0.53 |
0.46 |
3,506,361 |
3,035,919 |
1,753,181 |
1,590,461 |
|
Total Probable |
448,603 |
0.48 |
0.39 |
4,284,673 |
3,511,449 |
2,142,337 |
1,943,497 |
|
Proven + Probable |
|||||||
|
Cactus West Open Pit |
139,104 |
0.33 |
0.20 |
907,470 |
556,857 |
453,735 |
411,622 |
|
Parks/Salyer Open Pit |
373,755 |
0.59 |
0.51 |
4,396,417 |
3,783,136 |
2,198,208 |
1,994,183 |
|
Total Proven + Probable |
512,859 |
0.52 |
0.42 |
5,303,886 |
4,339,993 |
2,651,943 |
2,405,805 |
NOTES:
- Mineral Reserves have an effective date of September 17, 2025. The Qualified Person for the open pit estimates of Parks/Salyer and Cactus West is Gordon Zurowski of AGP Mining Consultants Inc.
- The Mineral Reserves were estimated in accordance with the CIM Definition Standards for Mineral Resources and Reserves;
- The Mineral Reserves are supported by an open pit mine plan, based on designs and schedules, guided by relevant optimization procedures. Inputs to that process are:
- Metal prices of Cu $4.20/lb
- Processing costs which are variable and based upon material type, processing destination, copper grade, and copper recovery. Processing costs include a fixed unit cost component of $1.50/t, a net acid consumption cost, and a $0.33/lb cost for refining and selling copper cathode.
- General and administration cost of $0.40/t processed.
- Spatially variable royalty costs of 2.50%, 2.54% and 0.00% for Parks/Salyer and 2.54% for Cactus West
- Process recoveries which are variable based upon total soluble copper grade (CU-AS + CU-CN).
- Open pit geotechnical design criteria from Call and Nicholas Inc.
- Open pit mining costs including an escalation factor with pit depth and variable base costs by material type to reflect differing blasting requirements.
- No allowance for mining dilution or ore loss has been provided in the open pit mining inventories.
- Ore/Waste delineation in open pit areas was based on a Block Value cut-off of $0/t considering metal prices, recoveries, royalties, process, and G&A costs as per LG shell parameters stated above.
- The life-of-mine (LoM) stripping ratio in tons is 3.3.1.
- All figures are rounded to reflect the relative accuracy of the estimate. Totals may not sum due to rounding as required by reporting guidelines.
TABLE 7: Cactus Project Mineral Resource Estimates
|
Material Type |
Tons kt |
Grade CuT % |
Grade Cu Tsol % |
Contained Total Cu (k lbs) |
Contained Cu Tsol (k lbs) |
Contained Total Cu Short Tons |
Contained Total Cu Tonnes |
|
Total Leachable |
101,500 |
0.91 |
0.79 |
1,853,400 |
1,605,800 |
926,700 |
840,700 |
|
Total Primary |
29,900 |
0.42 |
0.05 |
251,000 |
30,200 |
125,500 |
113,800 |
|
Total Measured |
131,400 |
0.80 |
0.62 |
2,104,400 |
1,636,000 |
1,052,200 |
954,500 |
|
Total Leachable |
658,000 |
0.48 |
0.42 |
6,354,900 |
5,580,200 |
3,177,400 |
2,882,500 |
|
Total Primary |
353,400 |
0.36 |
0.04 |
2,535,900 |
270,900 |
1,268,000 |
1,150,300 |
|
Total Indicated |
1,011,400 |
0.44 |
0.29 |
8,890,800 |
5,851,100 |
4,445,400 |
4,032,800 |
|
Total Leachable |
759,500 |
0.54 |
0.47 |
8,208,300 |
7,186,000 |
4,104,200 |
3,723,200 |
|
Total Primary |
383,200 |
0.36 |
0.04 |
2,786,900 |
301,100 |
1,393,400 |
1,264,100 |
|
Total M&I |
1,142,800 |
0.48 |
0.33 |
10,995,200 |
7,487,100 |
5,497,600 |
4,987,300 |
|
Total Leachable |
95,100 |
0.40 |
0.34 |
760,900 |
653,400 |
380,500 |
345,200 |
|
Total Primary |
138,400 |
0.34 |
0.04 |
947,100 |
121,500 |
473,600 |
429,600 |
|
Total Inferred |
233,400 |
0.37 |
0.17 |
1,708,100 |
774,900 |
854,100 |
774,800 |
NOTES:
- Mineral Resources are inclusive of Mineral Reserves.
- Total soluble copper grades (Cu TSol) are reported using sequential assaying to calculate the soluble copper grade. Leachable material includes oxide and secondary enriched material types. Primary includes Primary Sulfide material. Tons are reported as short tons.
- Stockpile mineral resource estimates have an effective date of March 1, 2022, Cactus and Parks/Salyer mineral resource estimates have an effective date of September 16, 2025. All mineral resource estimates use a copper price of US$4.20/lb.
- Technical and economic parameters defining mineral resource conceptual pit shells: mining cost US$2.43/t; G&A US$0.55/t, 10% dilution, and 44°-46° pit slope angle.
- Technical and economic parameters defining underground mineral resource estimates: mining cost US$27.62/t, G&A US$0.55/t, and 5% dilution. Underground mineral resource estimates are only reported for material located outside of the conceptual open pit mineral resource estimate shells. Designation as open pit or underground mineral resources are conceptual and not indicative of the mining method that may be employed at the mine design stage.
- Technical and economic parameters defining processing: Oxide heap leach (HL) processing cost of US$2.24/t assuming 86.3% recoveries, enriched HL processing cost of US$2.13/t assuming 90.5% recoveries, sulphide mill processing cost of US$8.50/t assuming 92% recoveries. HL selling cost of US$0.27/lb; Mill selling cost of US$0.62/lb.
- Royalties of 2.54% applies to the Cactus private lands and an assumed 2.50% applies to state lands. No royalties apply to the Parks/Salyer South (formerly, the MainSpring property).
- Variable cut-off grades were reported depending on material type, conceptual mining method, potential processing method, and applicable royalties. For Cactus private lands and state lands - Oxide conceptual open pit or underground material = 0.087% or 0.483% TSol respectively; conceptual enriched open pit or underground material = 0.081% or 0.459% TSol respectively; conceptual Primary Sulphide open pit or underground material = 0.197% or 0.600% CuT respectively. For Parks/Salyer South – conceptual Oxide open pit or underground material = 0.085% or 0.471% TSol respectively; enriched open pit or underground material = 0.079% or 0.447% TSol respectively; conceptual Primary Sulphide open pit or underground material = 0.192% or 0.585% CuT respectively. Stockpile cutoff = 0.095% TSol.
- Mineral resources that are not mineral reserves do not have demonstrated economic viability. The estimate of mineral resources may be materially affected by environmental, permitting, legal, title, sociopolitical, marketing, or other relevant factors. See also more detailed Cautionary Statements at the end of this press release.
- The quantity and grade of reported Inferred mineral resources in this estimate are uncertain in nature and there is insufficient exploration to define these Inferred mineral resources as an Indicated or Measured mineral resource estimate; it is uncertain if further exploration will result in upgrading Inferred mineral resources to an Indicated or Measured classification. See also more detailed Cautionary Statements at the end of this press release.
- Totals may not add up due to rounding.
Metallurgy
Metallurgical testwork used for the PFS shows good metallurgical recoveries from all deposits with no deleterious elements. Testing, including 20 additional columns, in the PFS shows an average of 75% of total copper extracted inclusive of heap efficiency factor of 95%. A column leach testing program for oxides and enriched sulphides, from Parks/Salyer and Cactus, is ongoing at BaseMet and McClelland labs (Tucson, AZ and Reno, NV, respectively).
Mine waste is primarily alluvium and Gila conglomerate with minimal acid generation potential and a high neutralization potential. As a result, the mine waste reclamation efforts will be streamlined.
Project Location and Infrastructure
The Cactus Project is a brownfield project located approximately 6 miles (10 kilometres) northwest of the city of Casa Grande and 40 road miles south-southwest of the Greater Phoenix metropolitan area in Arizona. The Greater Phoenix area is a major population centre (approximately 4.8 million people) with a major airport and transportation hub and well-developed infrastructure and services that support the mining industry. The Cactus Project is directly accessible by state highways and connected to interstate highway 10. During historic ASARCO operations (1974-1984), a rail spur was connected directly with the Union Pacific Railroad to ship concentrates to its El Paso refinery in Texas; while the spur has been removed, the onsite rail line is still in existence. Current onsite infrastructure includes power lines and substation, water wells and a water pond, geological buildings, core sheds and administrative offices, contributing to a low capital intensity and robust economics.
Current onsite and nearby infrastructure includes:
- Onsite administration buildings, geology, core storage, substation and power lines, parking lot and access roads
- Power via onsite substation for $0.06/kWh (current year average)
- Paved access roads and easy access to Interstate Highways I-8 and I-10
- Union Pacific railroad line adjacent to the Cactus Project
- Casa Grande, Maricopa, Phoenix and Tucson are all located nearby to supply materials/consumables in addition to a skilled labour pool
- Adequate permitted groundwater available onsite, with potential for offsetting effluent water supply from the City of Casa Grande
- Flat land and low altitude
- Located adjacent to the City of Casa Grande industrial area
The Cactus Project will require the onsite facilities listed below, with no offsite infrastructure needed:
- Mining facilities include a truck shop with integrated mine engineering offices, truck wash, tire change station, heavy vehicle fuel station, light vehicle fuel station, and explosives storage
- Process facilities include the crushing facilities, SXEW process plant, reagents storage, process plant maintenance workshop, process plant lab, warehouse, and freshwater infrastructure
- Heap leach pads, PLS and Stormwater ponds, and associated equipment
- Power supply, distribution, and associated electrical rooms
- Ancillary facilities include process plant mine services guardhouses, administration trailer, maintenance structures, and weighing scale
- Catchments, ponds, drainage, and other site water management infrastructure
- The location of site facilities was based on the following criteria:
- Locate facilities within the established boundaries
- Minimize initial capital by using existing facilities, topography and infrastructure, where possible
- Comply with Code of Federal Regulations (CFR) Title 14 Part 77: Safe, Efficient Use, and Preservation of the Navigable Airspace, for potential obstructions near Casa Grande Municipal Airport
- Locate the rock storage facilities near the mine pits to reduce haul distance
Permitting and Social License
The Cactus Project is 100% owned by ASCU through its wholly-owned subsidiary Cactus 110 LLC, and encompasses an area of approximately 7,843 acres. The Cactus Project includes exploration and mining on private land and Arizona State Land Department ("ASLD”) leases. There is no federal nexus for permitting the Cactus Project and all permitting is limited to State and local required permits including the Aquifer Protection Permit, Industrial Air permits and the Mined Land Reclamation Permit, each of which ASCU has already received from regulators pertaining to the 2021 PEA. Permitting amendments will be submitted to address changes in the mine plan presented in this PFS, with an expected completion date in 2H 2026.
In keeping with ASCU's community engagement and partnership standards, the Cactus Project will be developed with a plan to establish and maintain the support of its host communities. ASCU commenced community outreach at the earliest stages of the Project and is currently evaluating and building partnerships within the community. ASCU understands the importance of outreach during its development and throughout the life of the mine. ASCU is encouraged by the positive response to the project from the community. Its status as a “brownfields” project makes it potentially more appealing than a new mine might be.
ASCU has a well-developed community engagement plan that it has implemented through numerous public meetings and outreach. With the presence of legacy mining in the Casa Grande area, the local community is supportive of the Cactus Project. There is no known significant opposition to the Cactus Project.
Royalties
The Cactus Project mineral reserves are subject to three net smelter return (“NSR”) royalties that apply to approximately 78% of all ore tons in the PFS mine plan. The MainSpring property, hosting part of the Parks/Salyer deposit, is not subject to any royalties. The Royal Gold and Elemental Altus NSR royalties that apply to Cactus West and a portion of Parks/Salyer total 2.54%. On a portion of the Parks/Salyer deposit, Bronco Creek Exploration Inc. holds a 0.5% NSR royalty, and ASLD holds a sliding royalty (2.0% to 8.0% and estimated at 2%), payable to the Arizona State Trust. Royalty percentages with ASLD will be formalized once the Cactus Project submits a Mineral Development Report to ASLD for conversion of the existing Mineral Exploration Permit to a Mineral Lease.
Project Financing
ASCU appointed Hannam & Partners (“H&P”) in June 2025, to assist the Company with securing the debt project financing for the Cactus Project. The Company and H&P are well underway in the process and advancing discussions with tier 1 lenders in the mining space. With an interest in obtaining low cost of capital debt for the Cactus Project, the Company began well ahead of the PFS completion, and in anticipation of a targeted financing completion date as early as the second half of 2026.
“Our financing strategy will focus on minimizing dilution and optimizing the Cactus Project’s strong cash generation potential,” said Nick Nikolakakis, ASCU CFO. “With the PFS confirming the financial strength of the Cactus Project, we have begun the process of engaging with a range of banks, private lenders and export-credit agencies to support a disciplined and capital efficient path to construction.”
Opportunities and Next Steps
The Cactus Project is reviewing several stand-alone opportunities for further optimization of the operation, including:
- Mine Expansion
- Exploration opportunities at Cactus West, Cactus East, Northeast Extension and Gap Zone
- North, Southwest and beneath the Cactus West pit between Cactus East and Cactus West
- Options for Cactus East development
- Options for late stage LoM primary sulphide inclusion (including leaching and flotation technologies)
- Exploration opportunities at Cactus West, Cactus East, Northeast Extension and Gap Zone
- Water - Opportunity to purchase Class A effluent, reducing dependence on higher cost ground water
- Power - Alternative power supply options
- Geotechnical and Hydrogeology
- Continued definition and optimization of pit engineering in the Gila Conglomerate.
- Definition at some zones of Parks/Salyer open pit are areas of study that could improve its economics.
- Mining Methods
- Material handling solutions including the potential for trolley assist for haulage, battery trucks, waste sizing/stacking systems, etc., could lower overall operating costs per ton and also per pound of copper produced. These are expected to be further detailed in the DFS
- Infrastructure
- Project water use includes a high demand for dust suppression. It is possible to reduce the use of water by adding surfactants, gravel, or pavement to reduce dust from the roadways. This should be evaluated as a way to minimize the environmental impact and preserve water resources
- Use of local railroad for delivery of reagents
- Use of in-pit crush conveying (IPCC) of waste reduces mine operating costs
- Options for the use of a near-pit crush and convey (NPCC) solution for waste rock transport and stacking.
- Nuton® Technology
The Cactus Project is studying the potential for incorporation of the Nuton® copper leaching technology. Nuton LLC is a Rio Tinto venture advancing a bio-heap leaching technology that produces copper from sulfide copper resources. The Nuton Technology targets ores that were previously too technically challenging or too costly to process, achieving high copper recoveries while significantly reducing water requirements up to 80% and carbon emissions up to 60% as compared to a concentrator. It is designed to produce a high-quality copper cathode on site in a single integrated process from primary sulphide through SXEW processing in a manner that does not generate tailings and that would eliminate the need for concentrating, smelting, and refining of sulphide copper. The Nuton Technology has demonstrated promising preliminary results with primary sulphide mineralized material, the type of material that underlies the oxide and enriched sulfide (predominantly chalcocite) at the Cactus Project.
The Technology is currently being tested at Nuton’s technical facilities as a parallel, separate optimization study on the Cactus Project. Various test applications and results have demonstrated that for certain material types under optimum conditions the Nuton Technology can achieve more than 80% copper extraction from primary copper minerals, such as chalcopyrite. If ongoing testing demonstrates the efficacy of the Technology with potential for economic leaching of primary sulphide copper mineralization, incorporation of such technology could improve overall Cactus Project economics.
Studies are ongoing to demonstrate the efficacy and viability of the Nuton Technology at the Cactus Project. If successful and the Technology is available for deployment at the Cactus Project on terms amenable to the Company, mine plan optimization for Nuton and relatively minor plant design modifications would be required to implement the Nuton Technology at the Cactus Project. The testing (including related studies) and any deployment of the Nuton Technology at the Cactus Project are subject to the terms of the option to joint venture agreement between Nuton and the Company’s wholly-owned subsidiaries, Cactus 110 LLC and Arizona Sonoran Copper Company USA Inc., dated December 14, 2023 (as amended), as more particularly described in the Company’s Annual Information Form dated March 27, 2025, available under the Company’s issuer profile on SEDAR+ (www.sedarplus.ca) and the Company’s website (www.arizonasonoran.com).
Quality Assurance and Quality Control Procedures
Skyline Labs is accredited in accordance with the recognized International Standard ISO/IEC 17025:2005. Their quality management system has been certified as conforming to the requirements defined in the International Standard ISO 9001:2015. The standard operating procedure (SOP) used while processing the ASCU samples was to process samples in groups of 20. Each tray consisted of 18 samples with samples No. 1 and No. 10 repeated as duplicates. The results from each tray were analyzed and any variance in the duplicates of more than 3% would result in the entire tray being re-assayed.
The results of these analyses, including the QA/QC checks, were transmitted to a qualified team of individuals at ASCU and the qualified persons.
Qualified Persons
Each of the persons listed below are authors of the PFS and have reviewed and verified the scientific and technical information contained in this press release as it relates to their respective specified areas of responsibility. By virtue of their education, experience and professional association membership, each of the below listed persons are considered “qualified person" as defined by NI 43-101.
Project Management, Roger Rivers, PE, M3 Engineering
Metallurgy, Laurie Tahija, QP-MMSA, M3 Engineering
Mineral Resources, Allan L. Schappert, CPG, SME-RM, ALS GeoResources LLC
Water and Environmental, R. Douglas Bartlett, CPG, PG. Clear Creek Associates, a subsidiary of Geo-Logic Associates
Mine Planning, Gordon Zurowski, P.Eng., AGP Mining Consultants Inc.
Nuton® Technology, Jim Sorensen, FAusIMM, Samuel Engineering
Links from the Press Release:
October 21, 2025 Webinar @ 1:00 pm ET: https://www.bigmarker.com/vid-conferences/arizona-sonoran-update
September 16, 2025: https://arizonasonoran.com/news-releases/arizona-sonoran-reports-11-billion-pounds-of-contained-copper-in-updated-cactus-mineral-resource-estimate-in-the-measured-and/
SEDAR+: https://www.sedarplus.ca
About Arizona Sonoran Copper Company (www.arizonasonoran.com | www.cactusmine.com)
ASCU’s objective is to become a mid-tier copper producer with low operating costs and to develop the Cactus and Parks/Salyer Projects that could generate robust returns for investors and provide a long term sustainable and responsible operation for the community and all stakeholders. The Company's principal asset is a 100% interest in the Cactus Project (former ASARCO, Sacaton mine) which is situated on private land in an infrastructure-rich area of Arizona. Contiguous to the Cactus Project is the Company’s 100%-owned Parks/Salyer deposit that could allow for a phased expansion of the Cactus Project once it becomes a producing asset. The Company is led by an executive management team and Board which have a long-standing track record of successful project delivery in North America complemented by global capital markets expertise.
Exhibit A: Annual Production, Recovery and Costs
|
Years |
Production Tons (000’s) |
Recovered Copper |
Costs ($lb)1 |
||||||
|
Tons Mined |
Parks/Salyer Processed |
Cactus Processed |
Total Tons Processed |
% TCu |
Tons |
klbs |
C1 Cost1 |
AISC1 |
|
|
1 |
170,000 |
28,000 |
- |
28,000 |
0.286 |
38,354 |
76,708 |
$4.42 |
$9.17 |
|
2 |
175,000 |
28,000 |
- |
28,000 |
0.324 |
67,005 |
134,009 |
$2.63 |
$5.40 |
|
3 |
169,000 |
28,000 |
- |
28,000 |
0.509 |
105,394 |
210,787 |
$1.65 |
$2.60 |
|
4 |
165,000 |
28,000 |
- |
28,000 |
0.447 |
114,003 |
228,006 |
$1.60 |
$2.15 |
|
5 |
160,000 |
22,000 |
- |
22,000 |
0.884 |
140,000 |
280,000 |
$1.26 |
$1.45 |
|
6 |
165,000 |
28,000 |
- |
28,000 |
0.450 |
125,332 |
250,663 |
$1.40 |
$1.44 |
|
7 |
155,000 |
23,000 |
- |
23,000 |
0.872 |
137,625 |
275,250 |
$1.24 |
$1.41 |
|
8 |
151,000 |
26,000 |
- |
26,000 |
0.654 |
140,000 |
280,000 |
$1.27 |
$1.54 |
|
9 |
145,000 |
20,000 |
- |
20,000 |
0.959 |
140,000 |
280,000 |
$1.23 |
$1.26 |
|
10 |
135,000 |
28,000 |
- |
28,000 |
0.505 |
123,761 |
247,521 |
$1.40 |
$1.44 |
|
11 |
45,638 |
20,000 |
- |
20,000 |
0.958 |
135,954 |
271,907 |
$0.78 |
$0.82 |
|
12 |
30,000 |
18,000 |
- |
18,000 |
1.034 |
140,000 |
280,000 |
$0.63 |
$0.69 |
|
13 |
28,042 |
28,000 |
- |
28,000 |
0.602 |
140,000 |
280,000 |
$0.60 |
$0.61 |
|
14 |
95,000 |
28,000 |
- |
28,000 |
0.316 |
96,301 |
192,601 |
$1.04 |
$1.06 |
|
15 |
95,200 |
11,456 |
16,544 |
28,000 |
0.286 |
61,428 |
122,855 |
$1.84 |
$1.91 |
|
16 |
65,063 |
9,299 |
18,701 |
28,000 |
0.443 |
68,857 |
137,714 |
$1.53 |
$1.58 |
|
17 |
75,566 |
- |
28,000 |
28,000 |
0.323 |
65,255 |
130,509 |
$1.68 |
$1.73 |
|
18 |
40,442 |
- |
28,000 |
28,000 |
0.287 |
48,567 |
97,134 |
$1.68 |
$1.72 |
|
19 |
32,777 |
- |
28,000 |
28,000 |
0.352 |
47,947 |
95,893 |
$1.50 |
$1.51 |
|
20 |
20,822 |
- |
19,859 |
19,859 |
0.408 |
41,350 |
82,700 |
$1.45 |
$1.46 |
|
21 |
- |
- |
- |
- |
- |
14,995 |
29,989 |
$0.26 |
$0.26 |
|
22 |
- |
- |
- |
- |
- |
1,774 |
3,547 |
$0.83 |
$0.83 |
Exhibit B: Annual Economics
|
Annual Economics ($k) |
||||||
|
Year |
Revenue |
Operating Cost |
Operating Income |
EBITDA1 |
Capital Expenditures1 |
FCF1 |
|
1 |
$326,008 |
$339,201 |
-$13,193 |
-$13,193 |
$364,262 |
-$370,631 |
|
2 |
$569,537 |
$351,600 |
$217,938 |
$217,040 |
$371,662 |
-$187,748 |
|
3 |
$895,846 |
$342,632 |
$553,215 |
$547,834 |
$200,790 |
$293,381 |
|
4 |
$969,026 |
$353,629 |
$615,397 |
$604,725 |
$125,388 |
$428,763 |
|
5 |
$1,190,000 |
$329,940 |
$860,060 |
$838,519 |
$53,733 |
$661,990 |
|
6 |
$1,065,319 |
$330,218 |
$735,101 |
$713,221 |
$7,914 |
$579,940 |
|
7 |
$1,169,813 |
$314,946 |
$854,867 |
$827,717 |
$45,621 |
$619,042 |
|
8 |
$1,190,000 |
$324,215 |
$865,785 |
$835,204 |
$76,067 |
$590,722 |
|
9 |
$1,190,000 |
$313,324 |
$876,676 |
$845,963 |
$9,599 |
$649,049 |
|
10 |
$1,051,964 |
$327,061 |
$724,903 |
$705,041 |
$9,459 |
$543,304 |
|
11 |
$1,155,604 |
$184,694 |
$970,910 |
$944,010 |
$10,787 |
$694,138 |
|
12 |
$1,190,000 |
$146,365 |
$1,043,635 |
$1,012,716 |
$15,627 |
$755,140 |
|
13 |
$1,190,000 |
$141,760 |
$1,048,240 |
$1,023,018 |
$4,571 |
$782,800 |
|
14 |
$818,556 |
$188,723 |
$629,833 |
$619,181 |
$4,814 |
$494,280 |
|
15 |
$522,136 |
$219,843 |
$302,293 |
$295,671 |
$7,948 |
$238,810 |
|
16 |
$585,286 |
$199,362 |
$385,924 |
$374,733 |
$6,789 |
$282,435 |
|
17 |
$554,663 |
$206,894 |
$347,768 |
$335,283 |
$6,018 |
$259,314 |
|
18 |
$412,821 |
$153,488 |
$259,333 |
$249,653 |
$4,322 |
$189,793 |
|
19 |
$407,545 |
$134,224 |
$273,321 |
$263,669 |
$1,152 |
$202,347 |
|
20 |
$351,475 |
$111,403 |
$240,071 |
$231,840 |
$765 |
$180,567 |
|
21 |
$127,451 |
$4,716 |
$122,735 |
$119,776 |
$0 |
$85,605 |
|
22 |
$15,073 |
$2,609 |
$12,464 |
$12,116 |
$0 |
$11,692 |
|
PRICE DECK - ASSUMPTIONS |
||
|
PRICE / RATE |
UNIT |
LONG TERM |
|
Copper |
$/lb |
4.25 |
|
Copper Cathode Premium |
$/lb |
Not Applied |
|
Weighted Average Recovery |
% CuT |
75 |
|
Sulfuric Acid |
$/ton |
160.00 |
|
Electricity |
$/kWh |
0.06 |
|
NSR Royalty |
% |
2.54% on Cactus and a portion of Parks/Salyer |
|
|
% |
0.5% on Bronco Creek (portion of PS) |
|
Effective Taxes |
% |
24.6 |
Non-IFRS Financial Measures
This press release contains certain non-IFRS financial measures, including Capex, sustaining capital/capex, sustaining costs, EBITDA, C1 cash costs, free cash flow, AISC and AIC. The Company believes that these measures, together with measures determined in accordance with IFRS, provide investors with an improved ability to evaluate the underlying performance or expected performance of the Company. Non-IFRS measures do not have any standardized meaning prescribed under IFRS, and therefore they may not be comparable to similar measures employed by other companies. The data is intended to provide additional information and should not be considered in isolation or as a substitute for measures of performance prepared in accordance with IFRS.
Non-IFRS financial measures used in this press release and common to the copper mining industry are defined below.
C1 Cash Cost and Total Cash Operating Cost: C1 cash cost and Total Cash Operating Cost are reflective of the cash cost incurred at each processing stage, from mining through to recoverable copper delivered to the market, net of any by-product credits, including mine operating, process plant operating, and general and administrative costs.
All-in Sustaining Costs ("AISC"): AISC is reflective of all of the expenditures that are required to produce a pound of copper from operations. AISC reported in the PFS includes total cash costs, sustaining capital, expansion capital and closure costs, but excludes corporate general and administrative costs and salvage.
All-in Costs (“AIC”): is AISC including taxes and initial capital costs.
Free Cash Flow or FCF: Free cash flow is net cash flow provided from operating activities less attributable capital expenditures.
Capital expenditures are classified as either sustaining capital expenditures or non-sustaining capital expenditures, depending on the nature of the expenditure. Sustaining capital expenditures typically represent capital expenditures including ongoing replacement of mine equipment and other capital facilities and other capital expenditures and is calculated as total additions to property, plant and equipment (as reported on the interim condensed consolidated statements of cash flows), less non-sustaining capital expenditures. Non-sustaining capital expenditures represent capital expenditures for major projects, including development costs of the Cactus Project.
Cautionary Statements regarding Forward-Looking Statements and Other Matters
Forward-Looking Statements
All statements, other than statements of historical fact, contained or incorporated by reference in this press release constitute “forward-looking statements” and “forward-looking information” (collectively, “forward-looking statements”) within the meaning of applicable Canadian and United States securities legislation. Generally, these forward-looking statements can be identified by the use of forward-looking terminology such as “accuracy”, “advancing”, “anticipated”, “assume”, “become”, “believe”, “building”, “capable”, “compelling”, “conceptual”, “contingency”, “continue”, “could”, “decision”, “deliver”, “design”, “develop”, “early as”, “embark”, “estimate”, “evaluating”, “expects”, “expected”, “factor”, “feasibility”, “focus”, “forward”, “future”, “indicates”, “intends”, “journey”, “keen”, “long-term”, “looking”, “model”, “next”, “objective”, “opportunities”, “optimizing”, “path”, “plan”, “positioned”, “potential”, “project”, “projected”, “projections”, “requirements”, “risk”, “sensitivities”, “stage”, “strategy”, “study”, “subject to”, “to be”, “target”, “towards”, “trend”, “underway”, “will”, or “viable”, and “workstream”, or variations of such words, and similar such words, expressions or statements that certain actions, events or results can, could, may, should, would, will (or not) be achieved, occur, provide, result or support in the future, or which, by their nature, refer to future events. In some cases, forward-looking information may be stated in the present tense, such as in respect of current matters that may be continuing, or that may have a future impact or effect. Forward-looking statements include those relating to the results of the Pre-Feasibility Study (or PFS) and other ongoing and future technical studies (including any Definitive Feasibility Study or DFS) and workstreams, and the continuation, completion, execution, results, and opportunities and next steps, and implications of such studies or workstreams (including any implementation thereof), and timing thereof (including Cactus Project economics and other key metrics and estimates (including net present value (or NPV), internal rate of return (or IRR), free cash flows (or FCF), EBITDA, revenues, margins, costs (including cash costs (or C1 costs), AISC, AIC, Opex (including power and mining costs) and Capex), capital intensity, production profile, life-of-mine (or LOM), mine and processing plans, benefits to the local community and Arizona economy) and the evaluation thereof); filing of the Technical Report in respect of the PFS and timing thereof; mineral resources and mineral reserves (or MRE) generally (including modelling thereof, ore and contained copper tonnage, grade estimates, recoveries, and applicable royalties), and any realization thereof (including mining and processing methods); de-risking of the Cactus Project; conceptual pit shells; the 2024 Preliminary Economic Assessment (or 2024 PEA) and the results thereof (including returns and other economics), the entirety of which has have been superseded by the Pre-Feasibility Study (or PFS) reported in this press release; any final investment decision (including the timing, outcome and any implications thereof); project financing (including plan and timeline for advancing and securing financing for any construction and development of the Cactus Project, and the timing of completion and outcome thereof including availability, potential sources, structure, tenor, cost and other terms, and basis therefor); Nuton® technology, ongoing related studies (including the results thereof) and any related opportunities for the Cactus Project (including any deployment of such at the Cactus Project and the timing, terms, and impact or other implications thereof); Cactus Project being a source of, and any contributions to refined copper supply, in the U.S.A.; and the Company’s objectives (including development of the Cactus Project, becoming a mid-tier copper producer with low operating costs, that could generate robust returns and provide a long-term sustainable and responsible operation for the community, investors and all stakeholders, and any other continuing or future successes). Although the Company believes that such statements are reasonable, there can be no assurance that those forward-looking statements will prove to be correct, and any forward-looking statements by the Company are not guarantees of future actions, results or performance. Forward-looking statements are based on assumptions, estimates, expectations and opinions, which are considered reasonable and represent best judgment based on available facts, as of the date such statements are made. If such assumptions, estimates, expectations and opinions prove to be incorrect, actual and future results may be materially different than expressed or implied in the forward-looking statements. The assumptions, estimates, expectations and opinions referenced, contained or incorporated by reference in this press release (including referenced prior press releases and other Company disclosure referenced or linked in this press release) which may prove to be incorrect include those set forth or referenced in this press release, as well as those stated in the Company’s Annual Information Form dated March 27, 2025 (the “AIF”), Management’s Discussion and Analysis (together with the accompanying financial statements) for the year ended December 31, 2024 and the quarters already ended and reported in 2025 (collectively, the “2024-25 Financial Disclosure”), and the Company’s other applicable public disclosure (collectively, “Company Disclosure”), all available on the Company’s website at www.arizonasonoran.com and under its issuer profile at www.sedarplus.ca. Forward-looking statements are inherently subject to known and unknown risks, uncertainties, contingencies and other factors which may cause the actual results, performance or achievements of ASCU to be materially different from any future results, performance or achievements expressed or implied by the forward-looking statements. Such risks, uncertainties, contingencies and other factors include, among others, the accuracy of the Pre-Feasibility Study (or PFS) and any other ongoing and future technical studies (including any Definitive Feasibility Study (or DFS)) and workstreams, and results and implications thereof (including Project scope, plans and economics) not being consistent with prior studies (including the 2024 PEA) or any eventual actual results, or otherwise not meeting expectations; the accuracy of the mineral resource and mineral reserve estimates (or MRE) for the Cactus Project (including related modelling) and the Company’s analysis thereof, and such estimates, modelling and analysis, not being consistent with actual results or otherwise not meeting expectations (including ore and contained copper tonnages, grade, recoveries and applicable royalties), and future mineral resource and mineral reserve estimates (or MRE) for the Cactus Project not being consistent with the mineral resource and mineral reserve estimates (or MRE) reported in and relied upon in the PFS (see also further cautionary statements below under the heading “Mineral Resource Estimates”); Nuton® technology (including ongoing related studies) not demonstrating sufficient efficacy for, not proving feasible for application at, and/or not being available on amenable terms to, the Cactus Project and/or any eventual deployment of such technology at the Cactus Project not ultimately being successful (including the results, timing, costs and economics and other impact or implications thereof not meeting expectations) or not being deployed at all for any reason, among other risks, uncertainties, contingencies and other factors, including the “Risk Factors” in the AIF, and the risks, uncertainties, contingencies and other factors identified in the 2024-25 Financial Disclosure. The foregoing list of risks, uncertainties, contingencies and other factors is not exhaustive; readers should consult the more complete discussion of the Company’s business, financial condition and prospects that is provided in the AIF, the 2024-25 Financial Disclosure and other Company Disclosure. Although ASCU has attempted to identify important factors that could cause actual actions, events or results to differ materially from those described in forward-looking statements, there may be other factors that cause actions, events or results to differ from those anticipated, estimated or intended. Forward-looking statements contained herein are made as of the date of this press release (or as otherwise expressly specified) and ASCU disclaims any intention or obligation to update or revise any forward-looking statements, whether as a result of new information, future events or results or otherwise, except as required by applicable securities laws. There can be no assurance that such information will prove to be accurate, as actual results and future events could differ materially from forward-looking statements. Accordingly, readers should not place undue reliance on forward-looking statements. The forward-looking statements referenced or contained in this press release are expressly qualified by these Cautionary Statements as well as the Cautionary Statements in the AIF, the 2024-25 Financial Disclosure and other Company Disclosure.
Mineral Resource Estimates
Until mineral deposits are actually mined and processed, copper and other mineral resources (which include mineral reserves) must be considered as estimates only. Mineral resource estimates that are not classified as mineral reserves do not have demonstrated economic viability. The estimation of mineral resources (including mineral reserves) is inherently uncertain, involves subjective judgement about many relevant factors and may be materially affected by, among other things, environmental, permitting, legal, title, taxation, socio-political, marketing, or other known and unknown risks, uncertainties, contingencies and other factors described in the foregoing Cautionary Statements on Forward-Looking Statements. The quantity and grade of reported “inferred” mineral resource estimates are uncertain in nature and there has been insufficient exploration to define “inferred” mineral resource estimates as an “indicated” or “measured” mineral resource and it is uncertain if further exploration will result in upgrading “inferred” mineral resource estimates to an “indicated” or “measured” mineral resource category. Inferred mineral resource estimates may not form the basis of feasibility or pre-feasibility studies or economic studies except for preliminary economic assessments. The accuracy of any mineral resource estimate (including mineral reserves) is a function of the quantity and quality of available data, and of the assumptions made and judgments used in engineering and geological interpretation, which may prove to be unreliable and depend, to a certain extent, upon the analysis of drilling results and statistical inferences that may ultimately prove to be inaccurate. It cannot be assumed that all or any part of a “inferred”, “indicated” or “measured” mineral resource estimate will ever be upgraded to a higher category including a mineral reserve. The mineral resource estimates (including mineral reserves) declared by the Company were estimated, categorized and reported using standards and definitions in accordance with the Canadian Institute of Mining, Metallurgy and Petroleum Definition Standards for Mineral Resources and Mineral Reserves (the “CIM Standards”) in accordance with National Instrument 43-101 of the Canadian Securities Administrators (“NI 43-101”), which governs the public disclosure of scientific and technical information concerning mineral projects.
U.S. Readers
The terms “mineral reserve”, “proven mineral reserve”, “probable mineral reserve”, “mineral resource”, “measured mineral resource”, “indicated mineral resource”, and “inferred mineral resource”, as disclosed by the Company are Canadian mining terms defined in the CIM Standards (collectively, the “CIM Definitions”) in accordance with NI 43-101. NI 43-101 establishes standards for all public disclosure that a Canadian issuer makes of scientific and technical information concerning mineral projects. These Canadian standards differ from the requirements of the United States Securities and Exchange Commission (the “SEC”) applicable to United States domestic and certain foreign reporting companies under Subpart 1300 of Regulation S-K (“S-K 1300”). Accordingly, information describing mineral resource estimates (including mineral reserves) for the Cactus Project may not be comparable to similar information publicly reported in accordance with the applicable requirements of the SEC, and so there can be no assurance that any mineral resource estimate (including mineral reserves) for the Cactus Project would be the same had the estimates been prepared per the SEC’s reporting and disclosure requirements under applicable United States federal securities laws, and the rules and regulations thereunder, including but not limited to S-K 1300. Further, there is no assurance that any mineral resource or mineral reserve estimate that the Company may report under NI 43-101 would be the same had the Company prepared such estimates under S-K 1300.
Preliminary Economic Assessments
The 2024 Preliminary Economic Assessment (or 2024 PEA) referenced in this press release was only a conceptual study of the potential viability of the Cactus Project as of its effective date and the economic and technical viability of the Cactus Project has not been demonstrated. The 2024 PEA was preliminary in nature and provided only an initial, high-level review of the Cactus Project’s potential and design options. The 2024 PEA has been superseded in its entirety by the Pre-feasibility Study (or PFS) reported in this press release.
View source version on businesswire.com: https://www.businesswire.com/news/home/20251020093272/en/
