The Alligator Indicator explained
By Kristoff De Turck - reviewed by Aldwin Keppens
Last update: Apr 27, 2023
Introduction
This indicator was introduced by Bill Williams, trader and technical analyst. From his studies (doctorate in psychology), he strongly emphasizes the behavioral aspect of active trading, which, according to him, determines the course of market movements. He stated that not the objective valuations but the ever-changing subjective perceptions thereof are decisive for the way markets move. An investor must therefore be able to move quickly and adjust his positions to the prevailing market structure.
The Alligator is one of the best known indicators by Bill Williams. It consists of three moving average lines which are used to detect when a trend is emerging. It is important to note that shares are only in a clear trend phase 15 to 30% of the time. So that means that in the vast majority of the time (70 to 85%) the stock is not in a clear trend.
Yet, according to the author, most of the money is made with the limited time that stocks are in a trend phase. It is therefore logical that it is very important to be able to identify and take advantage of these scarce moments in order to maximize the chances of profitable positions.
The different averages
The indicator uses three different smoothed averages, over 5, 8 and 13 periods respectively.
- The SMA5, being the lips of the Alligator, shown in green,
- The SMA8 (teeth), shown in red,
- The SMA13 (jaw), shown in blue.
Through this link you can consult the formula used to obtain the smoothed average.
Interpretation of the Alligator indicator
The signals given by the indicator are best illustrated by a few examples:
Example 1: Trend positive (jaw open upwards)
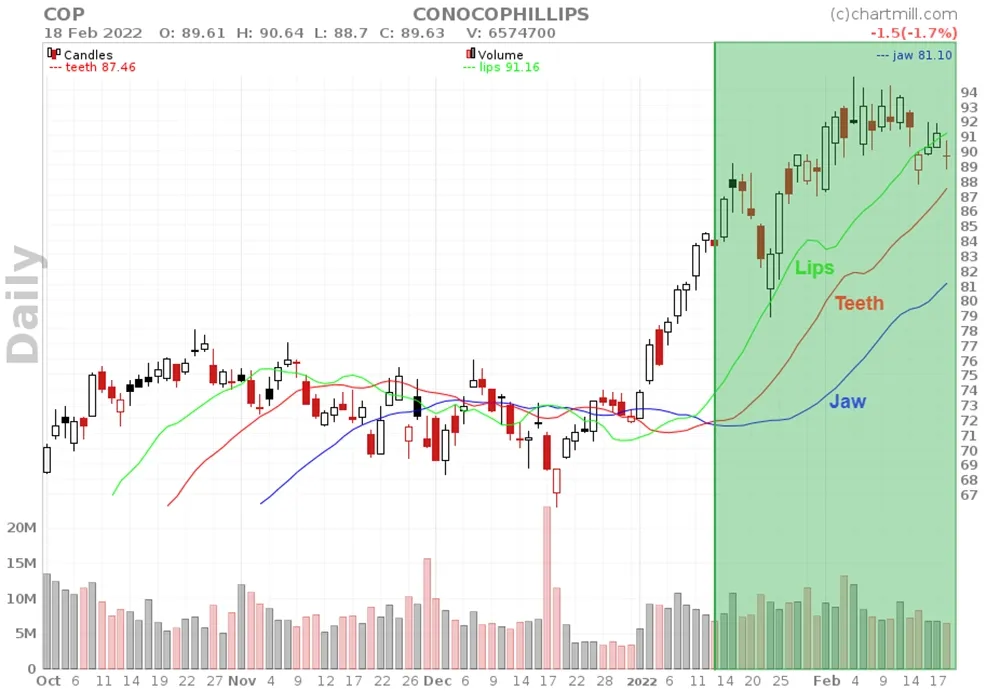
The chart above shows the Conocophillips (COP) stock, the beginning of the zone marked in green indicates the moment from when all three SMMAs are in perfect sequence, representing the open jaw of the crocodile. The trend is bullish.
Example 2: Trend neutral (jaw closed)
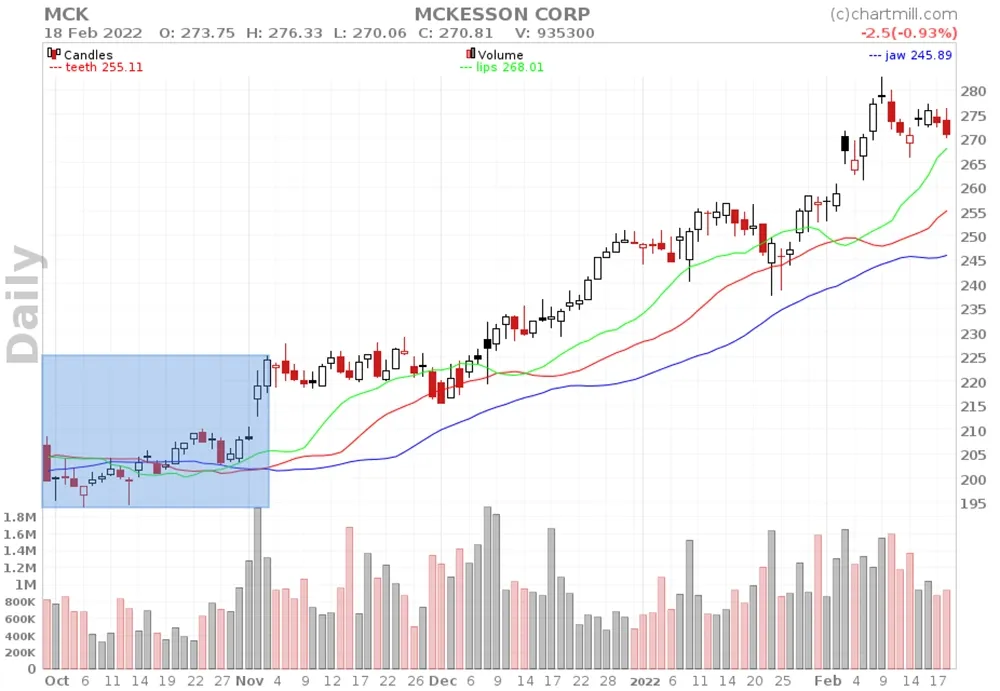
Mckesson Corp (MCK) stock is in a clear sideways trend (blue rectangle on the left of the chart). All three averages are very close to each other, so the alligator's jaw is closed. Only when both the green line (lips) and the red line (teeth) cross above the blue line (jaw) again, the neutral trend is completely over and the start of a new bullish trend begins.
Example 3: Trend negative (jaw open downward)
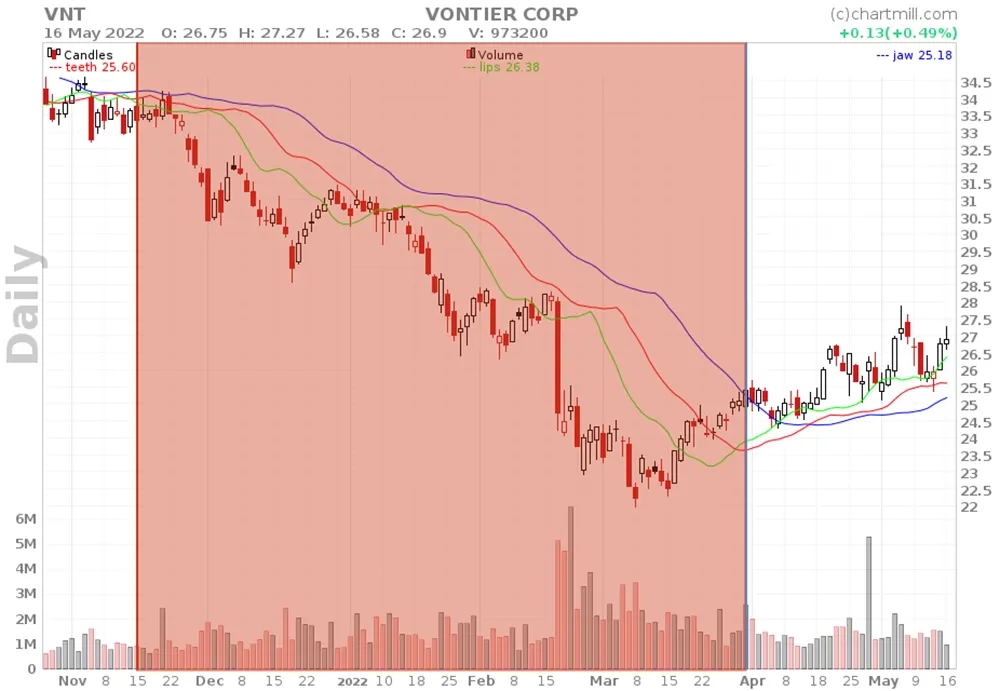
As of mid-November 2021, Vontier Corp (VNT) stock is showing a downward trend. All SMMAs are below each other in sequence, the alligator's jaw is wide open (downtrend). Only when the green line (lips) clearly rises above the red line (teeth) in early April 2022 the downtrend has ended and it turns into a neutral trend.
Of course, in many cases markets move a lot more erratically than what you see on the charts above. The chart below for the Asburby Automotive Group (ABG) share, for example, shows a price evolution that any trend trader will undoubtedly recognize... Whenever a new trend starts there is no continuation, so the signals from the indicator follow each other shortly and every position will be closed with a loss or at best breakeven.
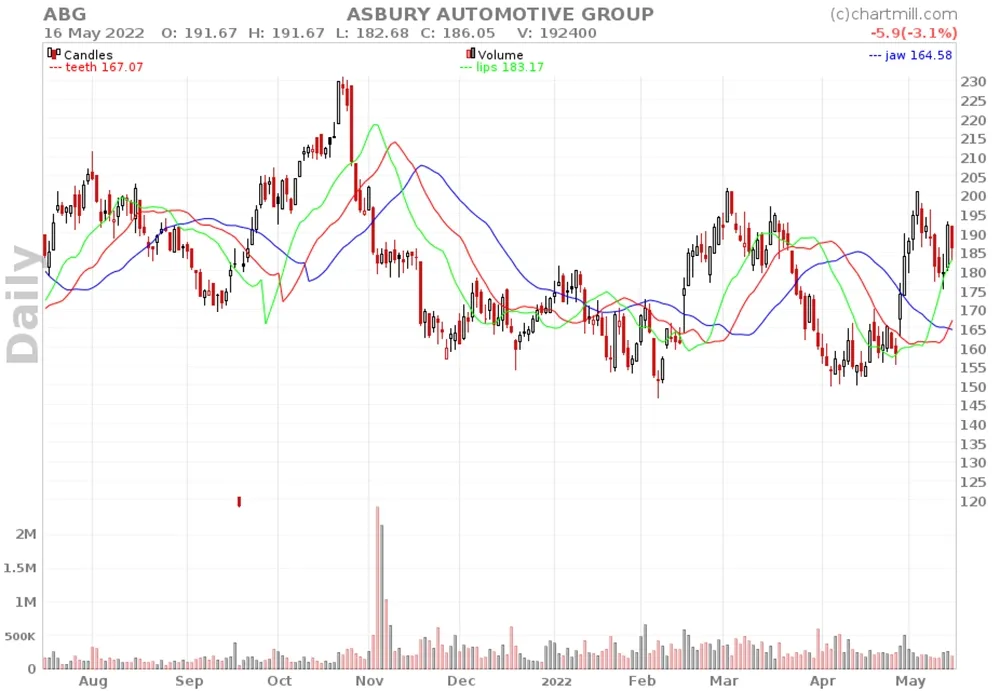
In other words, the Alligator indicator is subject to the same disadvantages as other trend indicators. The signal comes rather late which means that the new trend has already started for some time before the indicator gives the signal which leads to the confirmation of this trend. So this indicator is not meant to be used to open a position based on the trend recognition signal. Nevertheless, the indicator certainly has its uses because the way a positive, negative or neutral trend is recognized is completely objective.