Understanding the Aroon Indicator
By Kristoff De Turck - reviewed by Aldwin Keppens
Last update: Apr 27, 2023
Origin
It is not that unusual that a lot of the names given to technical indicators sound rather exotic. This is certainly the case with this indicator which was designed by Tushar Chande in 1995. Chande is a technical analyst with more than 25 years of experience, he is the creator of many widespread and popular technical indicators such as this Aroon indicator. But also the Stoch RSI, for example, was developed by him.
The name of the indicator literally refers to "the dawn's early light" in Sanskrit. The connection with the world of technical analysis is quickly made. The dawn is a reference to 'the new trend' and with the early light there is a reference to the ability of the indicator to make that new trend visible at an 'early stage'.
How is the Aroon-indicator calculated?
The indicator actually consists of two separate indicators. There is the Aroon-up and the Aroon-down line.
- Aroon-up = ((25 - Periods since 25-period High)/25) X 100
- Aroon-down = ((25 - Periods since 25-period Low)/25) X 100
Where 25 is the default value of the indicator parameter and 'period' is the timeframe used. On a daily chart this reads as "days since the 25 day high".
All values are calculated as a percentage value indicating the time since the previous high within the specified period (default '25').
- Aroon-up: This measures how long it has been since the prices reached a new high within a predefined period (in the calculation example above 25 periods). If the highest price of the most recent period is the highest within that predefined period then the Aroon-up will have a value of 100. In case the highest price is exactly at the beginning of the predefined period then the value will be 0,50 is the exact midpoint. This means that with a standard period of 25 the value '50' corresponds exactly to 12,5 periods.
- Aroon-down: Logically, the Aroon-down will measure how long it has been since the prices reached a new low within a defined period. If the lowest price of the most recent period is the lowest within the predefined period then the Aroon-down will have a value of 100. In case the lowest price is exactly at the beginning of the predefined period then the value will be 0. Again, 50 is of course the midpoint which with a standard period of 25 corresponds to 12,5 periods.
It is important to remember that in a daily chart - where each period represents exactly 1 day - the value '50' will never be visible because this value corresponds to 12,5 days. The closest possible number less than 50 is 48 (13 days) and the closest possible value higher than 50 is 52 (12 days).
How is the Aroon indicator interpreted?
What is striking about this indicator is that it differs greatly from other momentum oscillators because this indicator focuses primarily on time. Indeed, the indicator changes as the time between a new high or low increases. The indicator is used to discover and anticipate new potential trends early on, identify sideways markets but also to visualize correction periods within existing trends. It is a very versatile indicator but it takes some practice to learn to interpret it correctly.
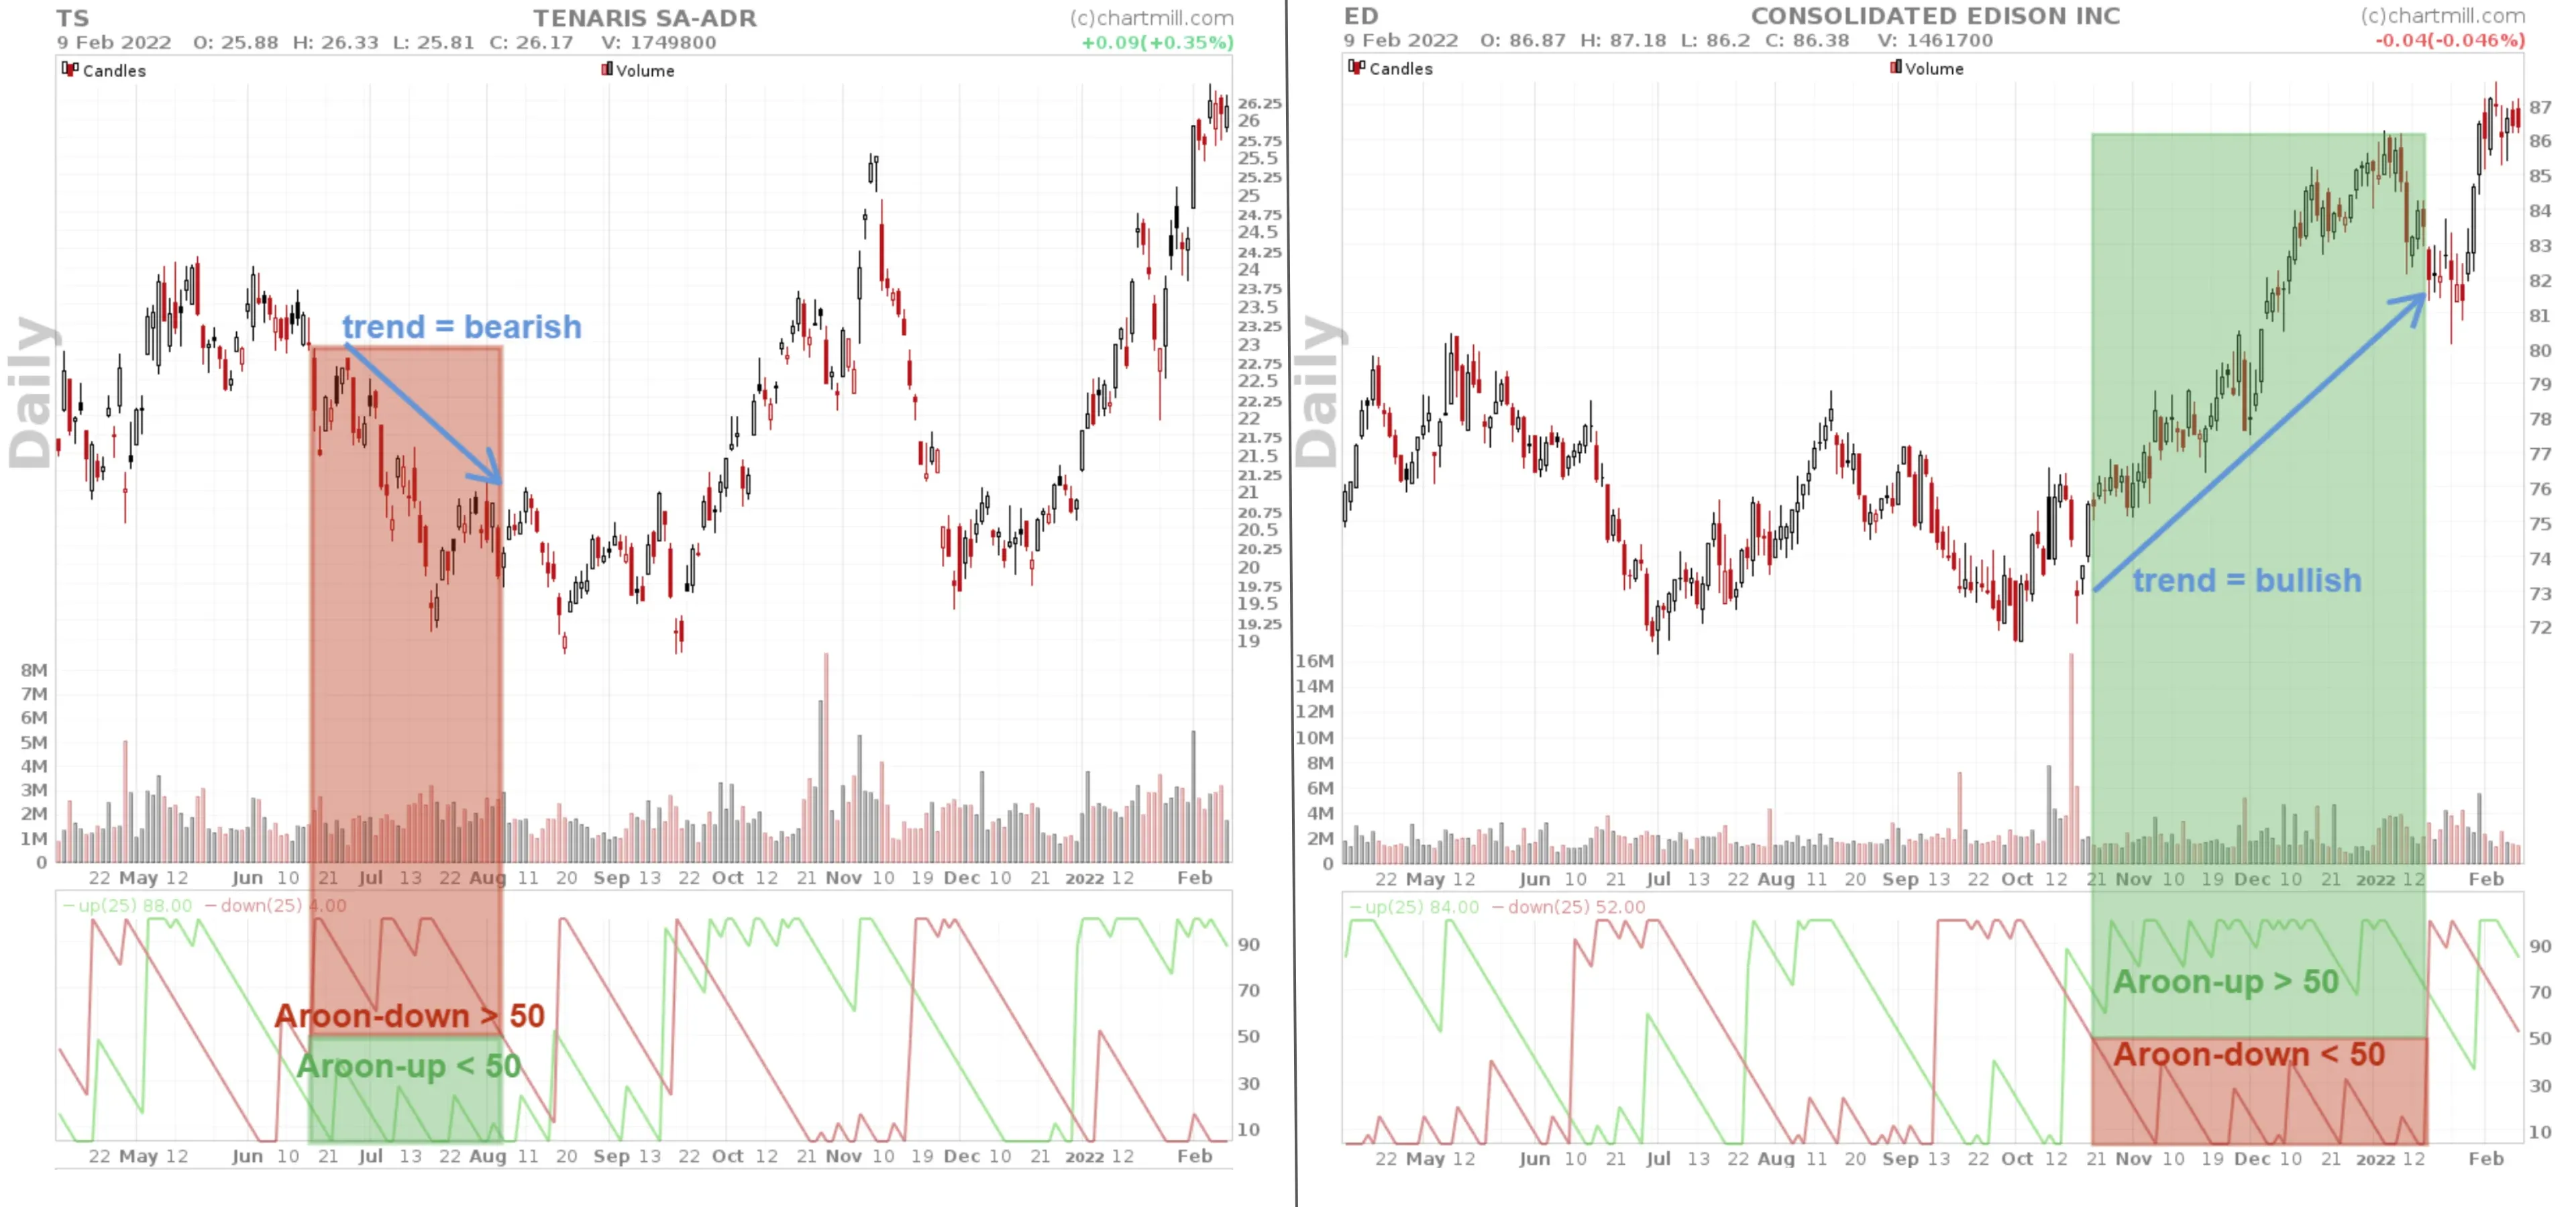
Basic Trend Filter
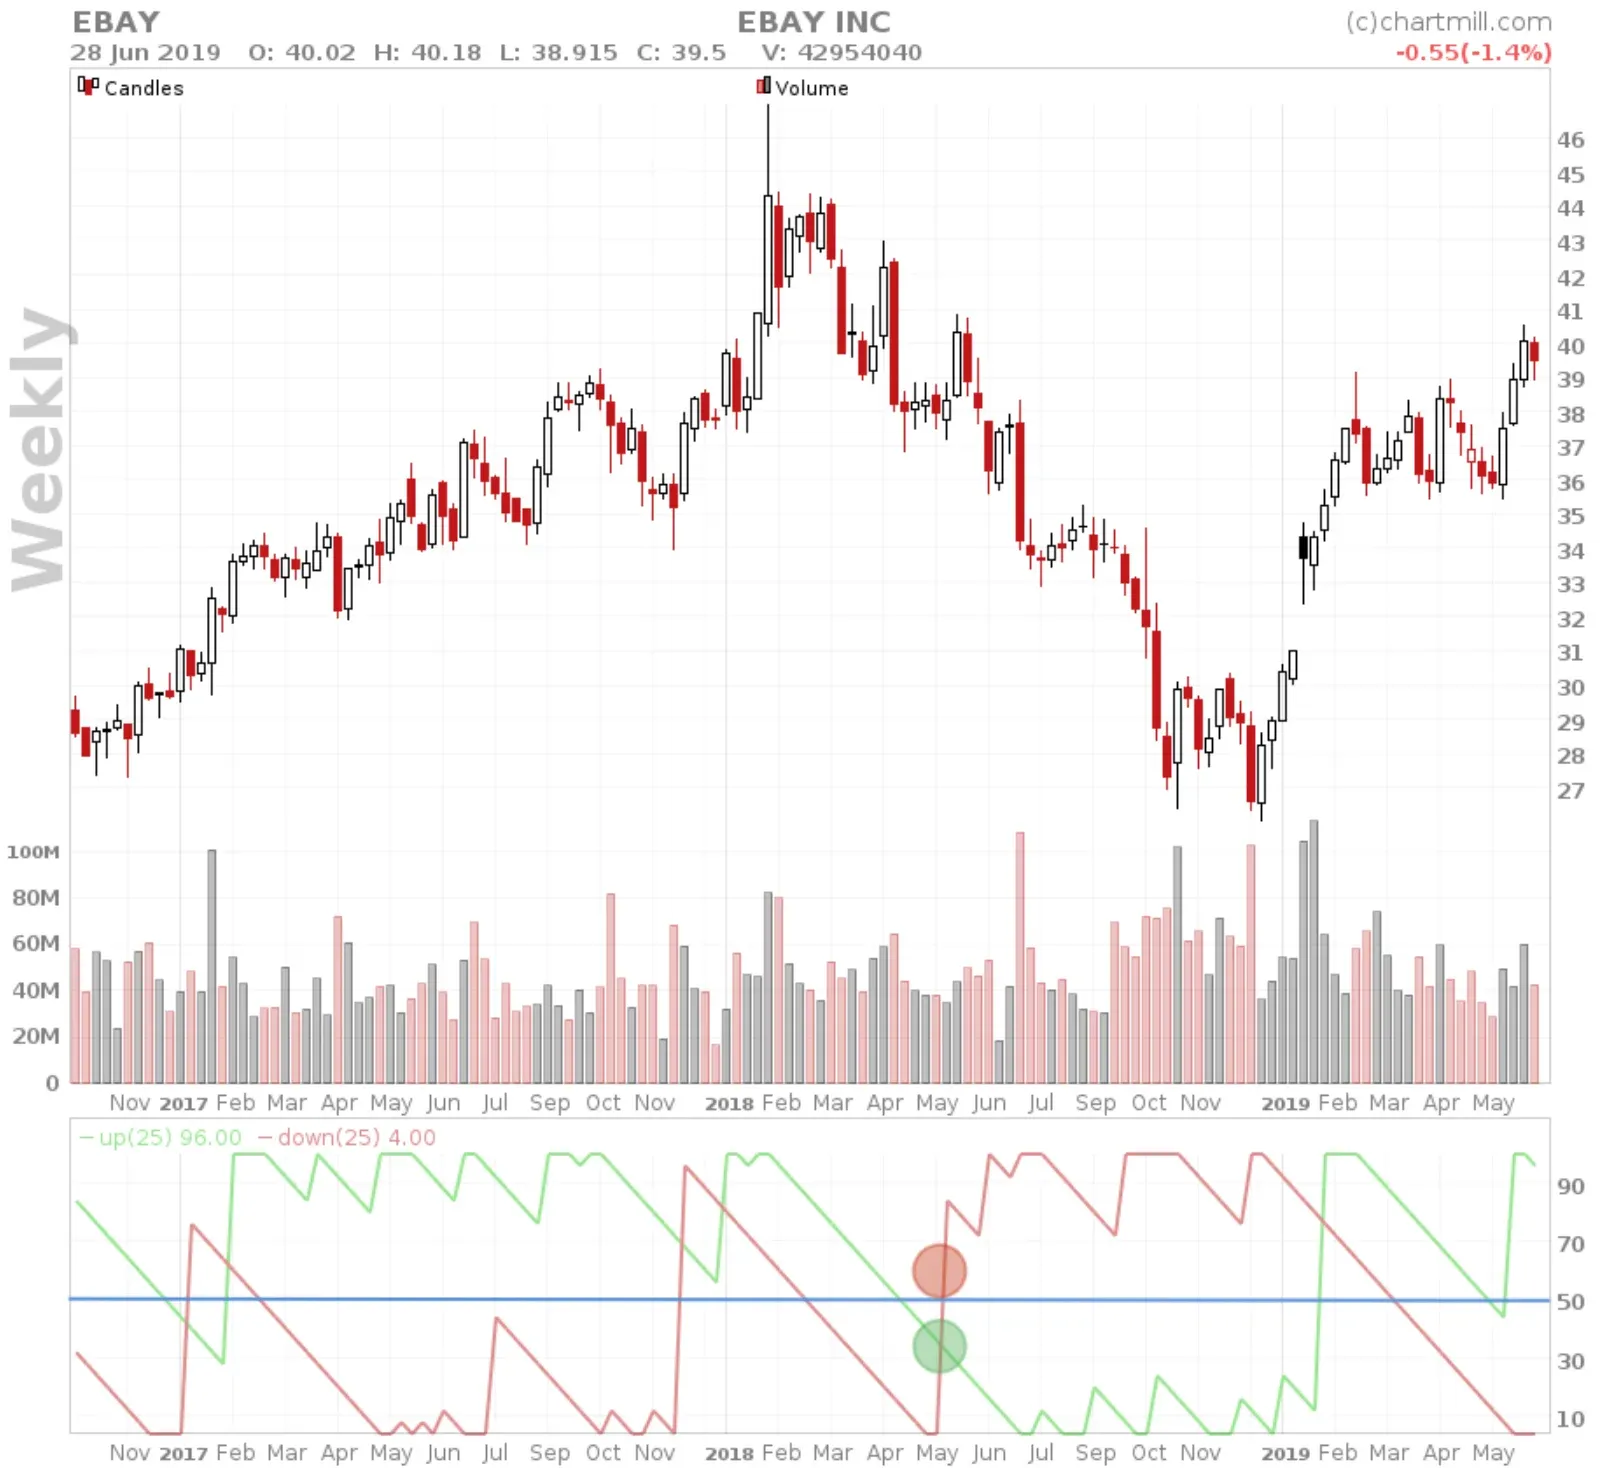
The most basic application is the location of the Aroon-up and Aroon-down in relation to the 50-level, this tells us something about the existing trend. This is considered positive if the Aroon-up is above 50 and Aroon-down is below 50 at the same time. Buyers are in favor. However, if the Aroon-up quotes below 50 and the Aroon-down quotes above 50 then the reverse is true. In that case it is the most recent lows that lie in the last half of the pre-specified period. Sellers are in the lead.
Identifying a new uptrend
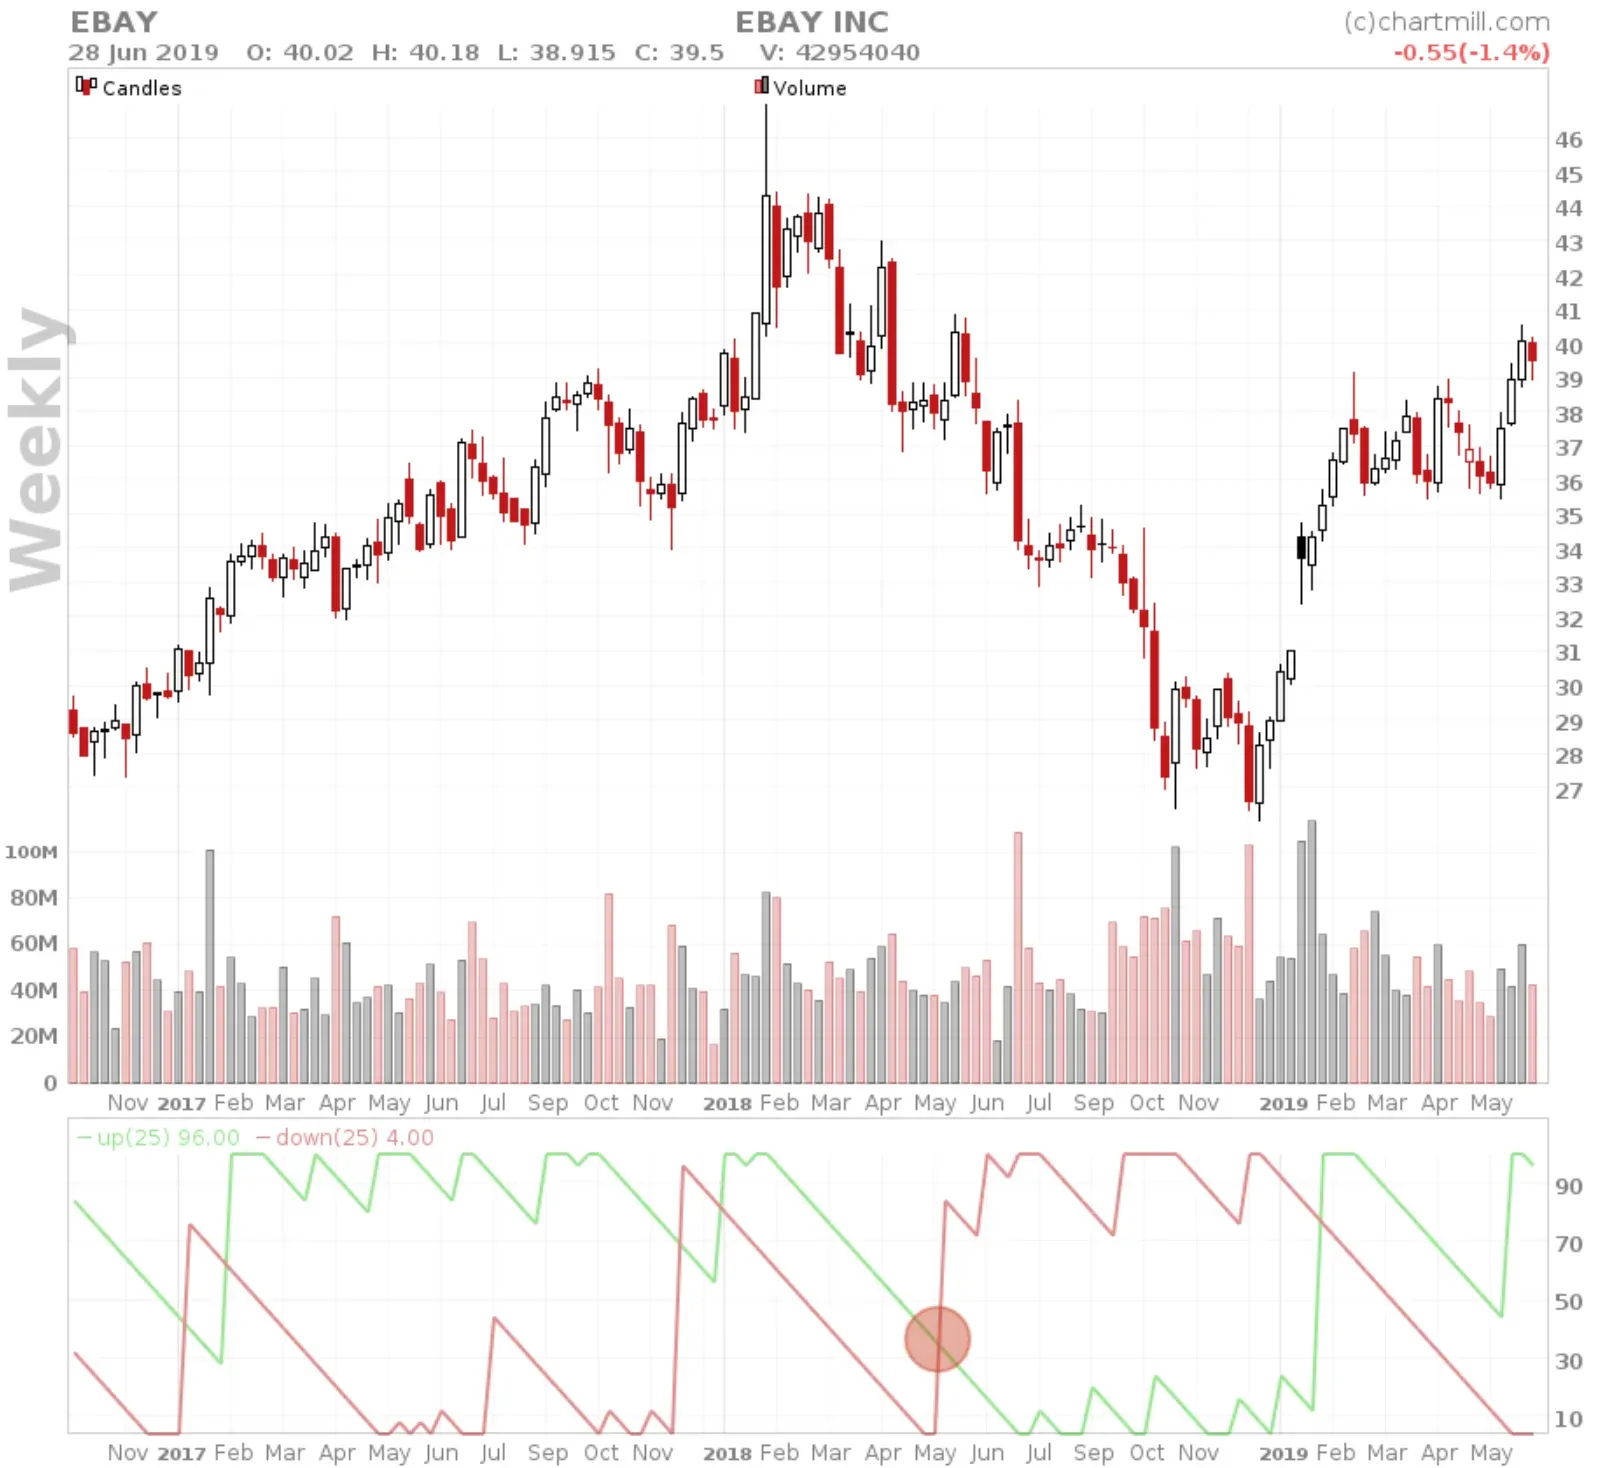
In order to detect possible new trends early, the progression of Aroon-up and Aroon-down is examined. The first important signal occurs when the Aroon-up moves above the Aroon-down, which means that new highs occur more recently than new lows.
This is followed by an initial confirmation when the Aroon-up is above 50 and the Aroon-down is below it.
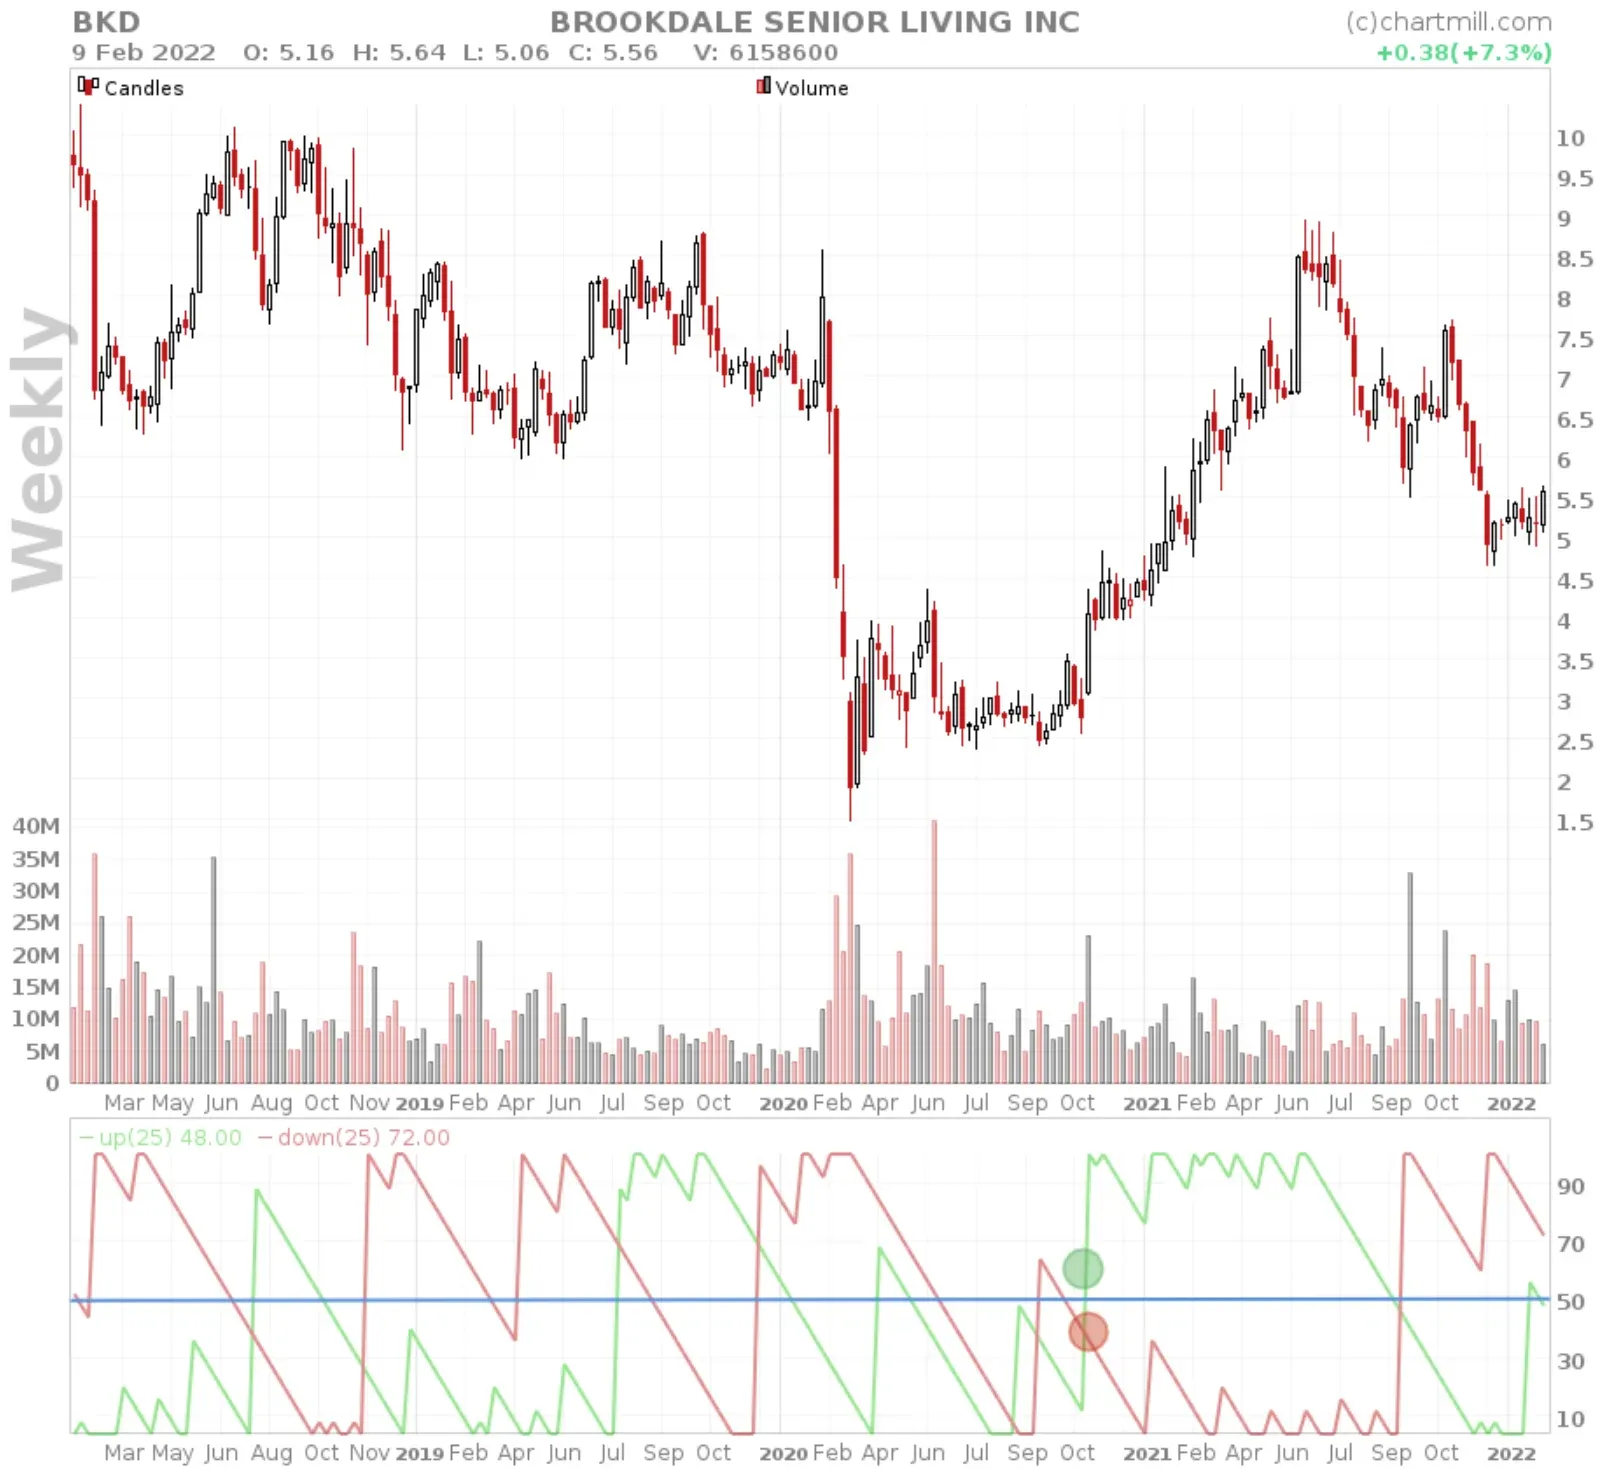
Lastly, there is the final confirmation at the time when the Aroon-up reaches the value of 100 while the Aroon-down continues to quote low.
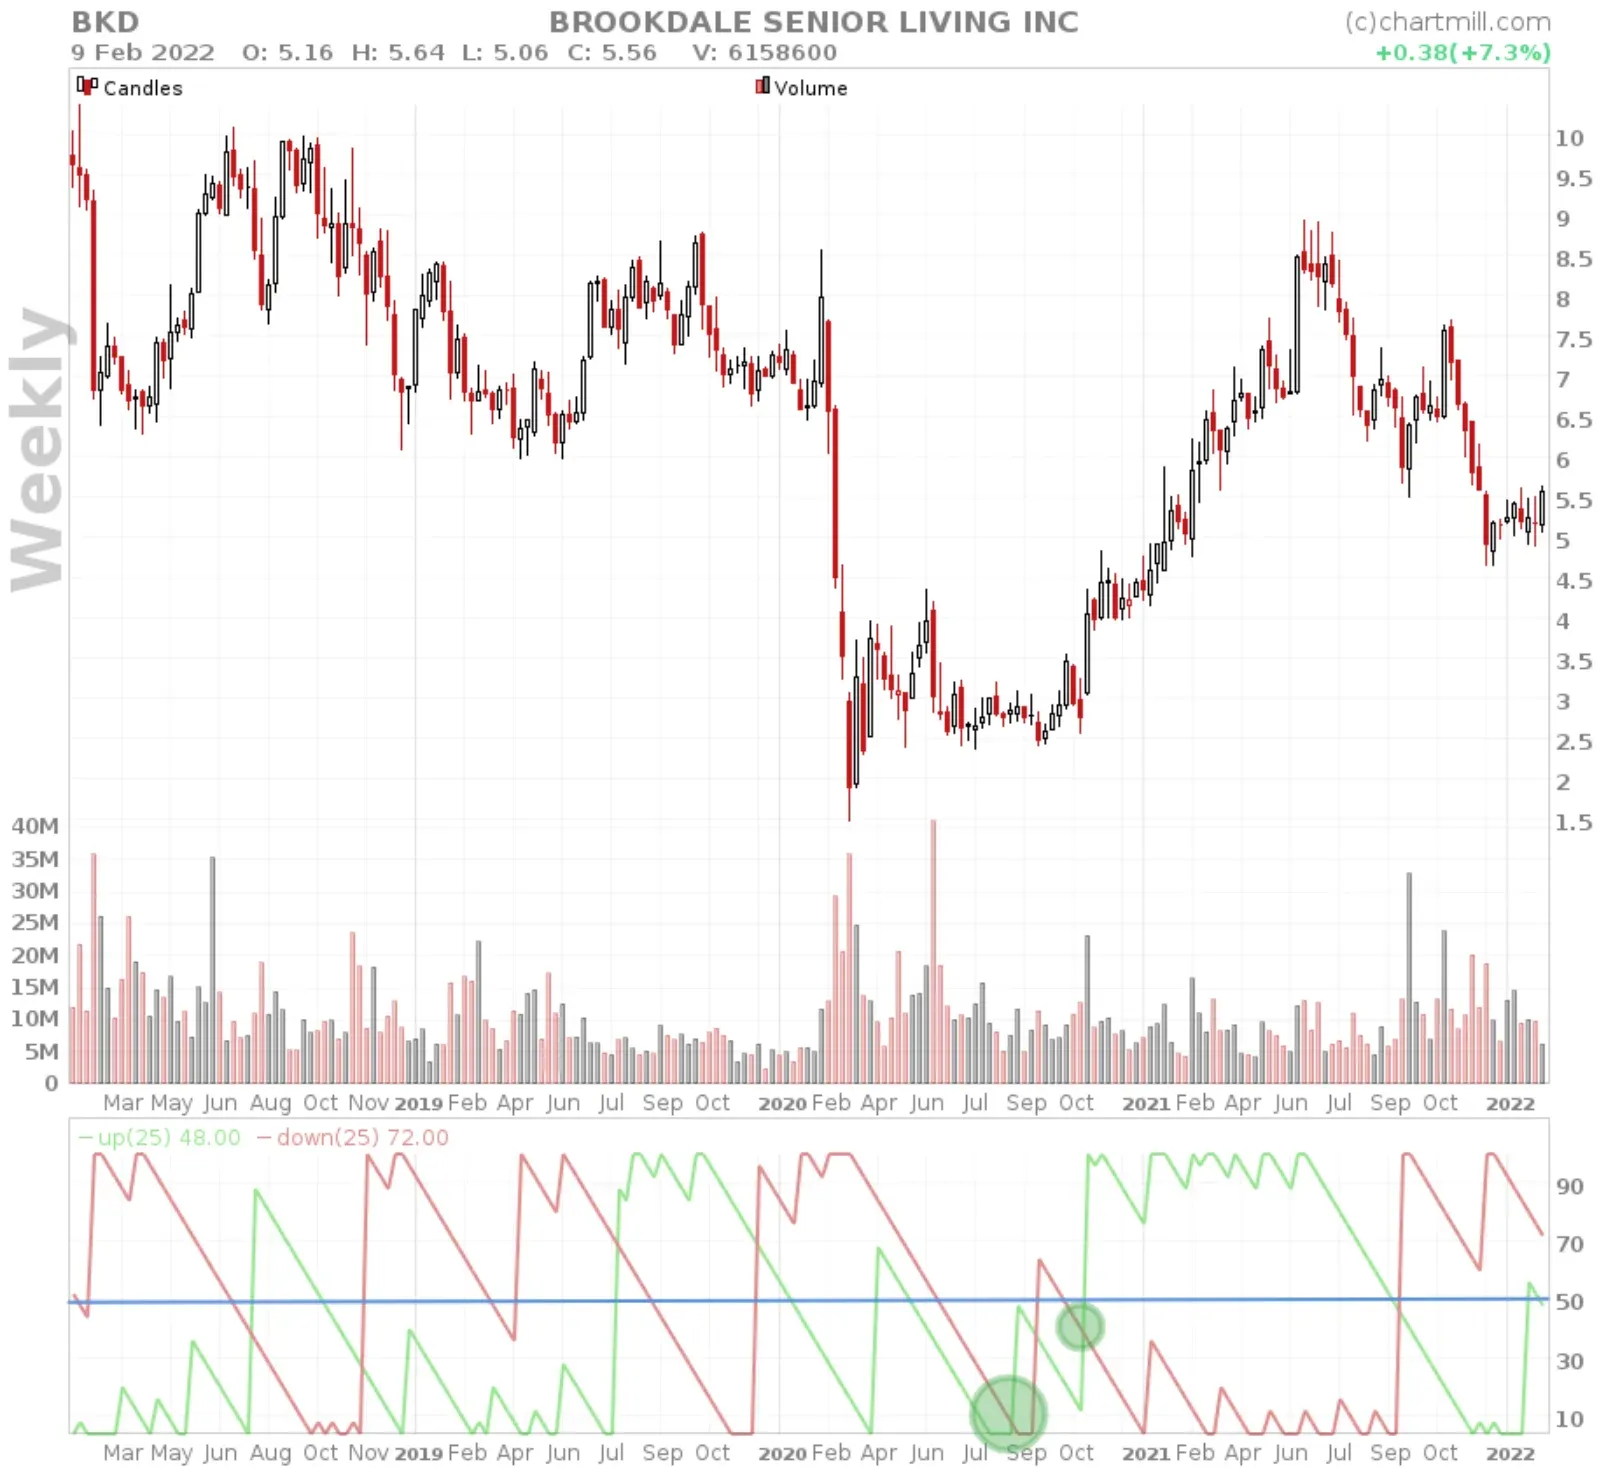
Identifying a new downtrend
The progression is exactly the same as for a new uptrend except that now it is the Aroon-down that is rising above the Aroon-up. New lows are more recent than new highs.
This is followed by an initial confirmation when the Aroon-down is above 50 and the Aroon-up is below.
Lastly, there is the final confirmation at the time when the Aroon-down reaches the value of 100 while the Aroon-up continues to quote low.
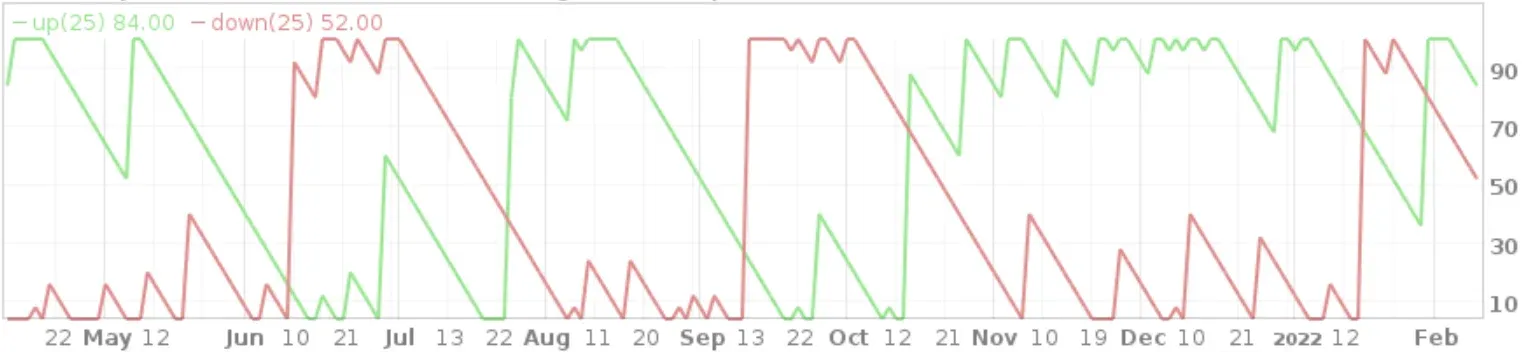
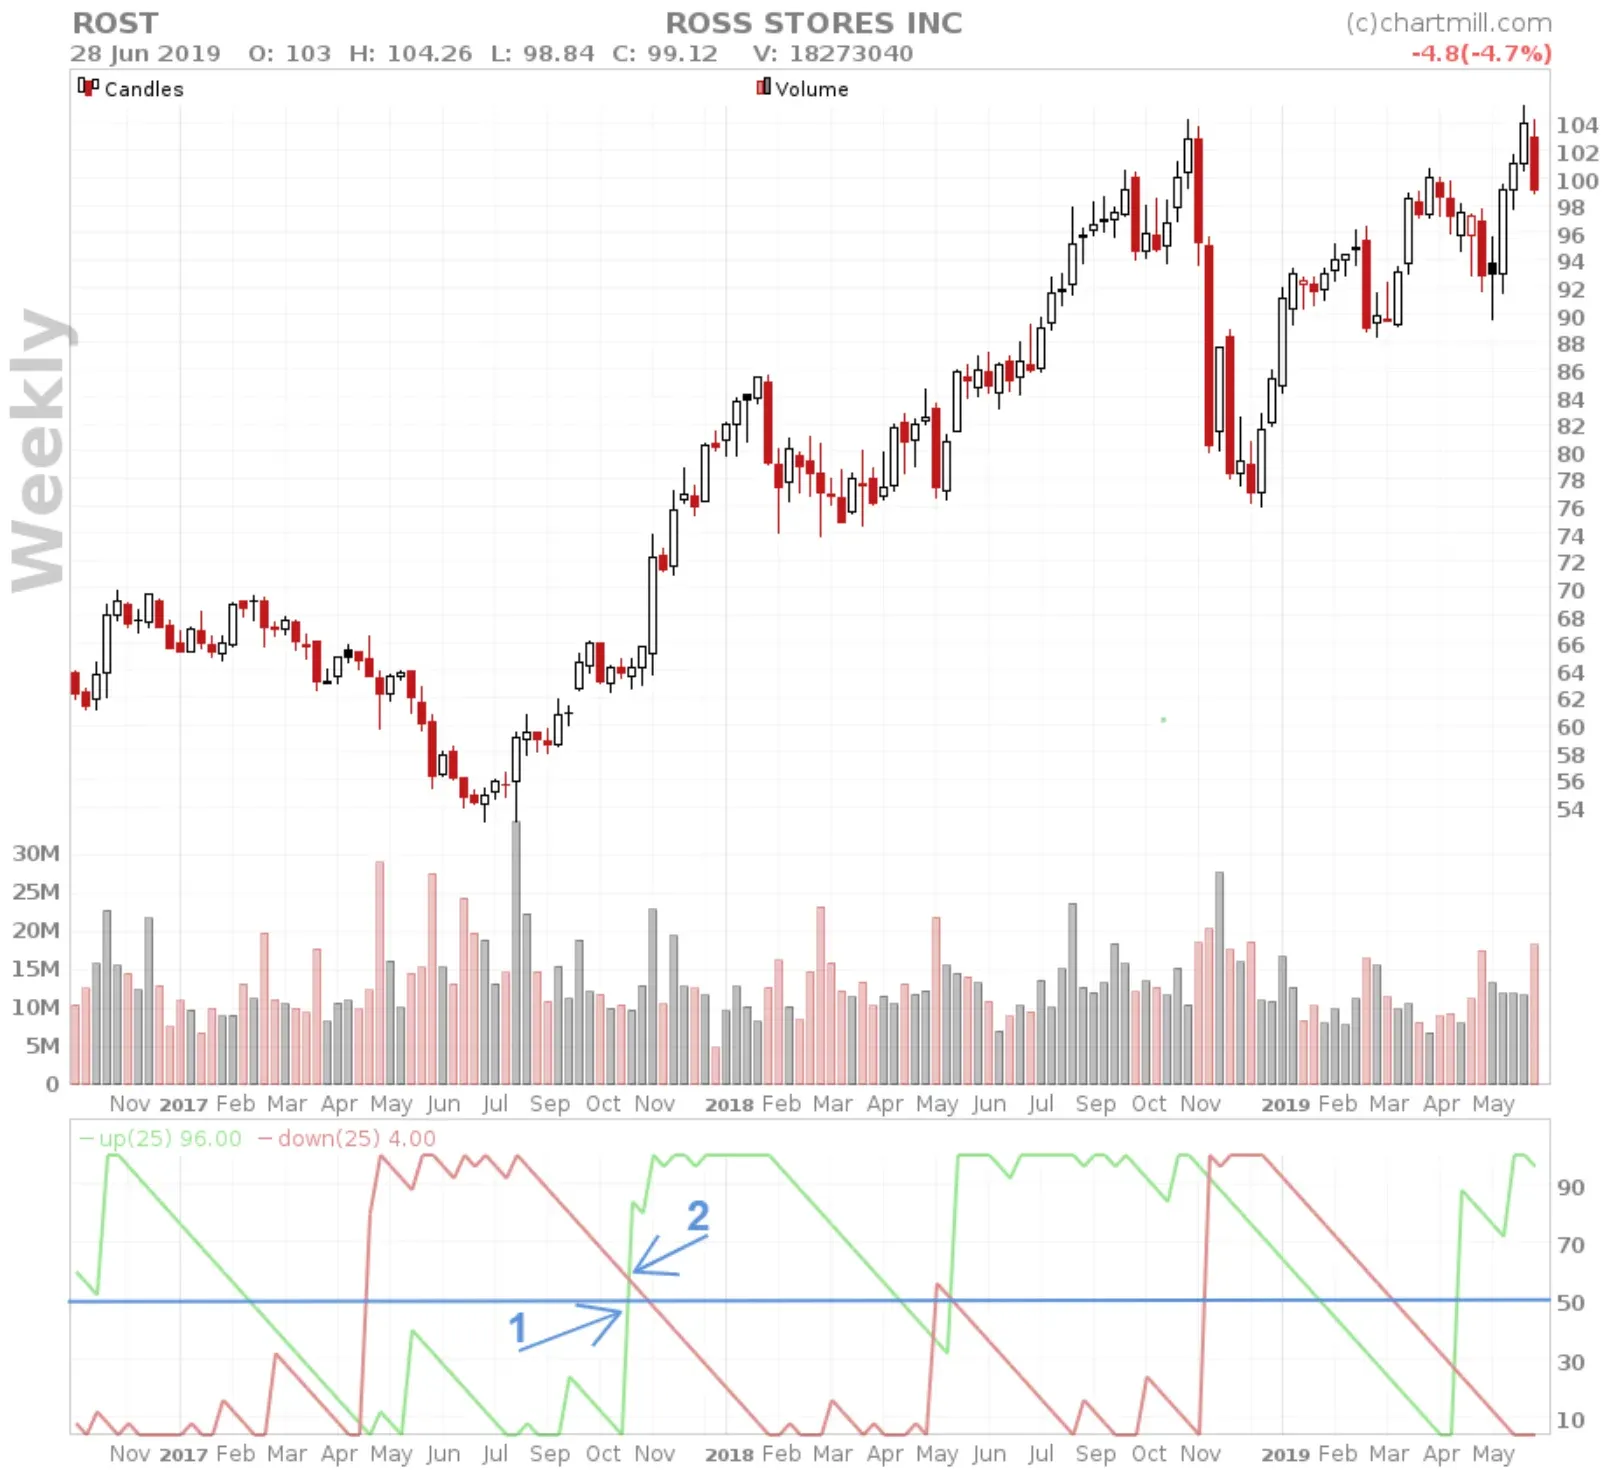
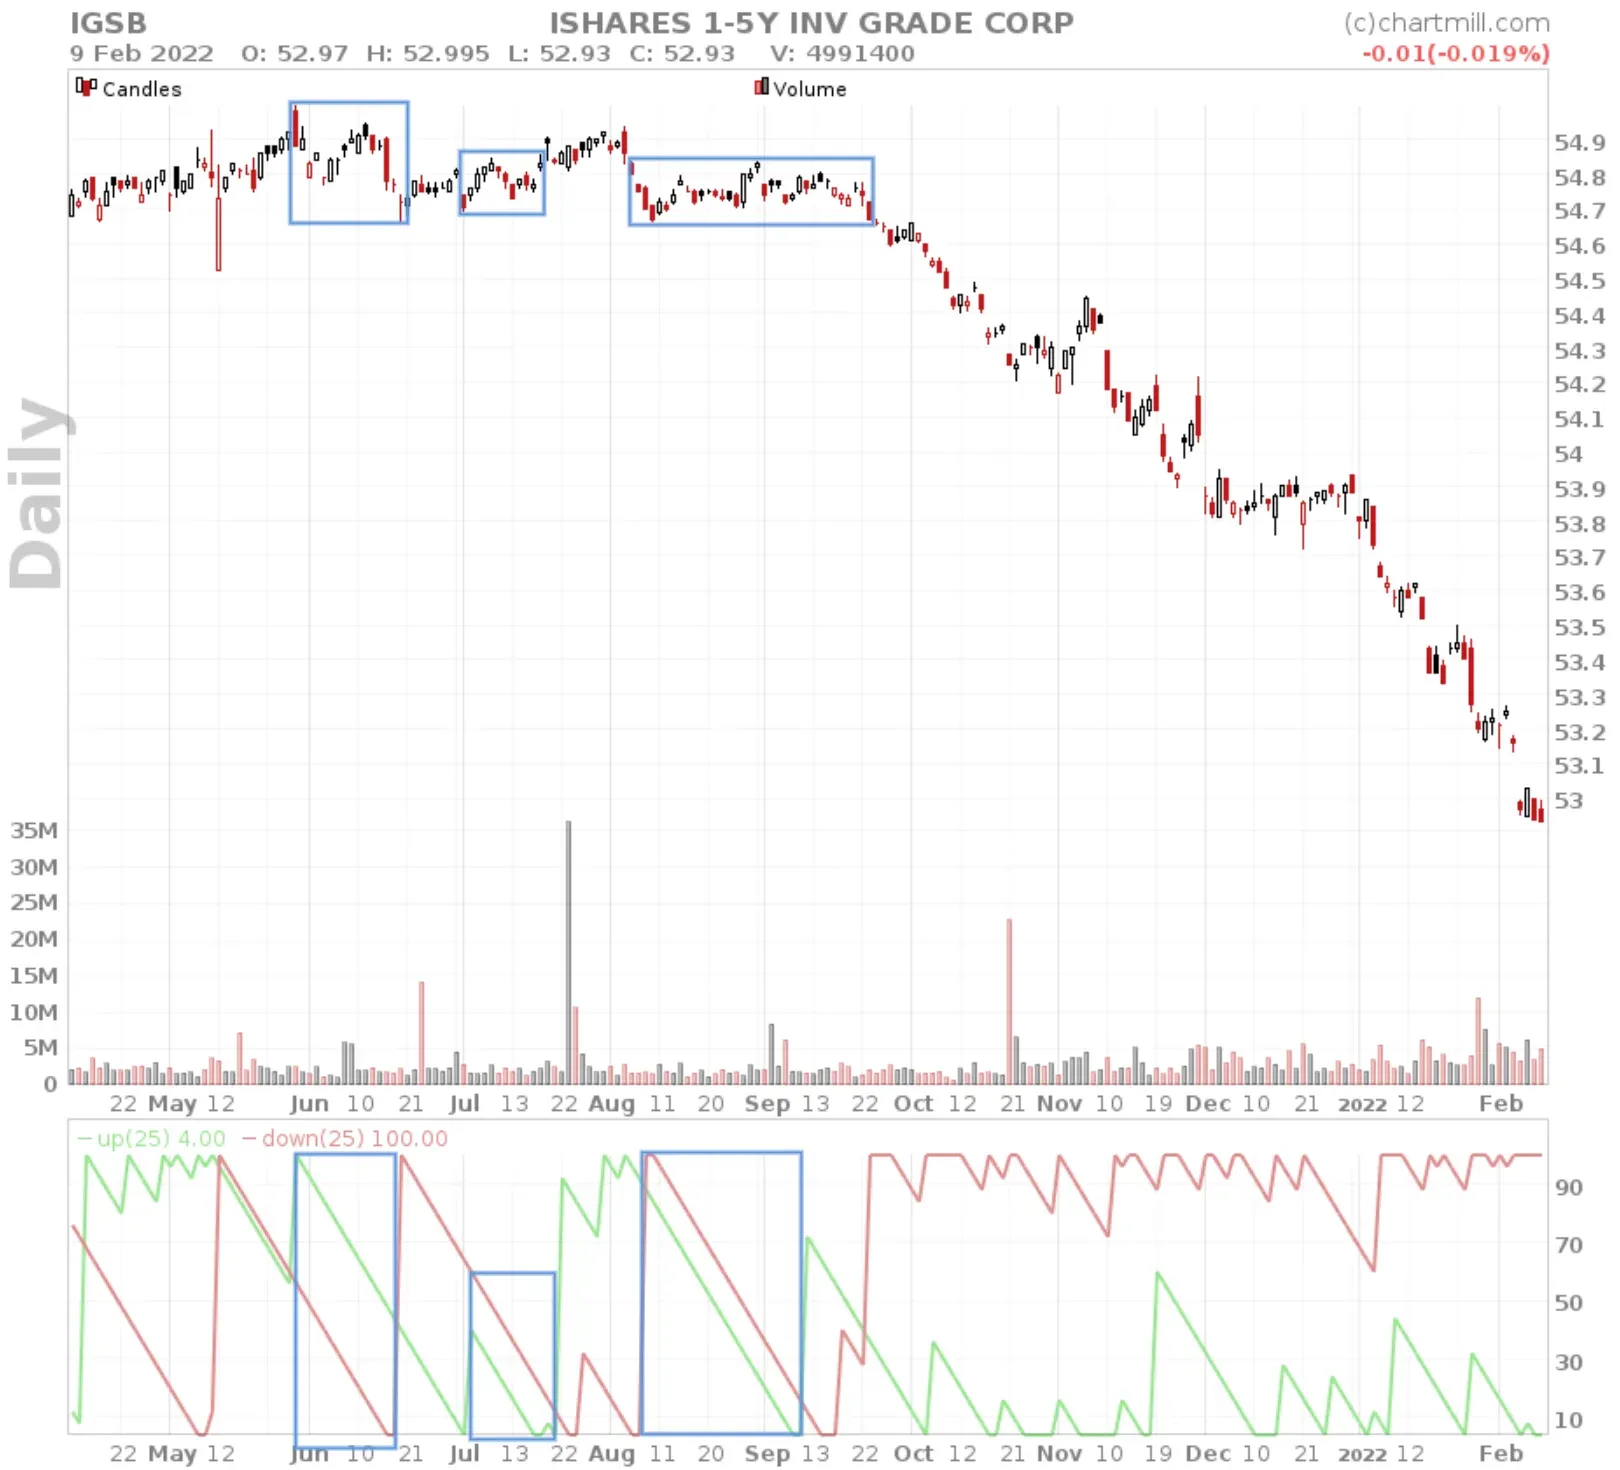
Keep in mind that the order of the signals does not have to follow this exact sequence. In the chart below, for example, you can see that the Aroon-down first rises above the 50 level and only afterwards crosses the Aroon-up.
Identifying a sideways market
Continued values of both the Aroon-up and Aroon-down below the 50-level are an indication that the market is moving sideways. Indeed, this implies that neither new highs nor lows were identified in the last half of the pre-specified period.
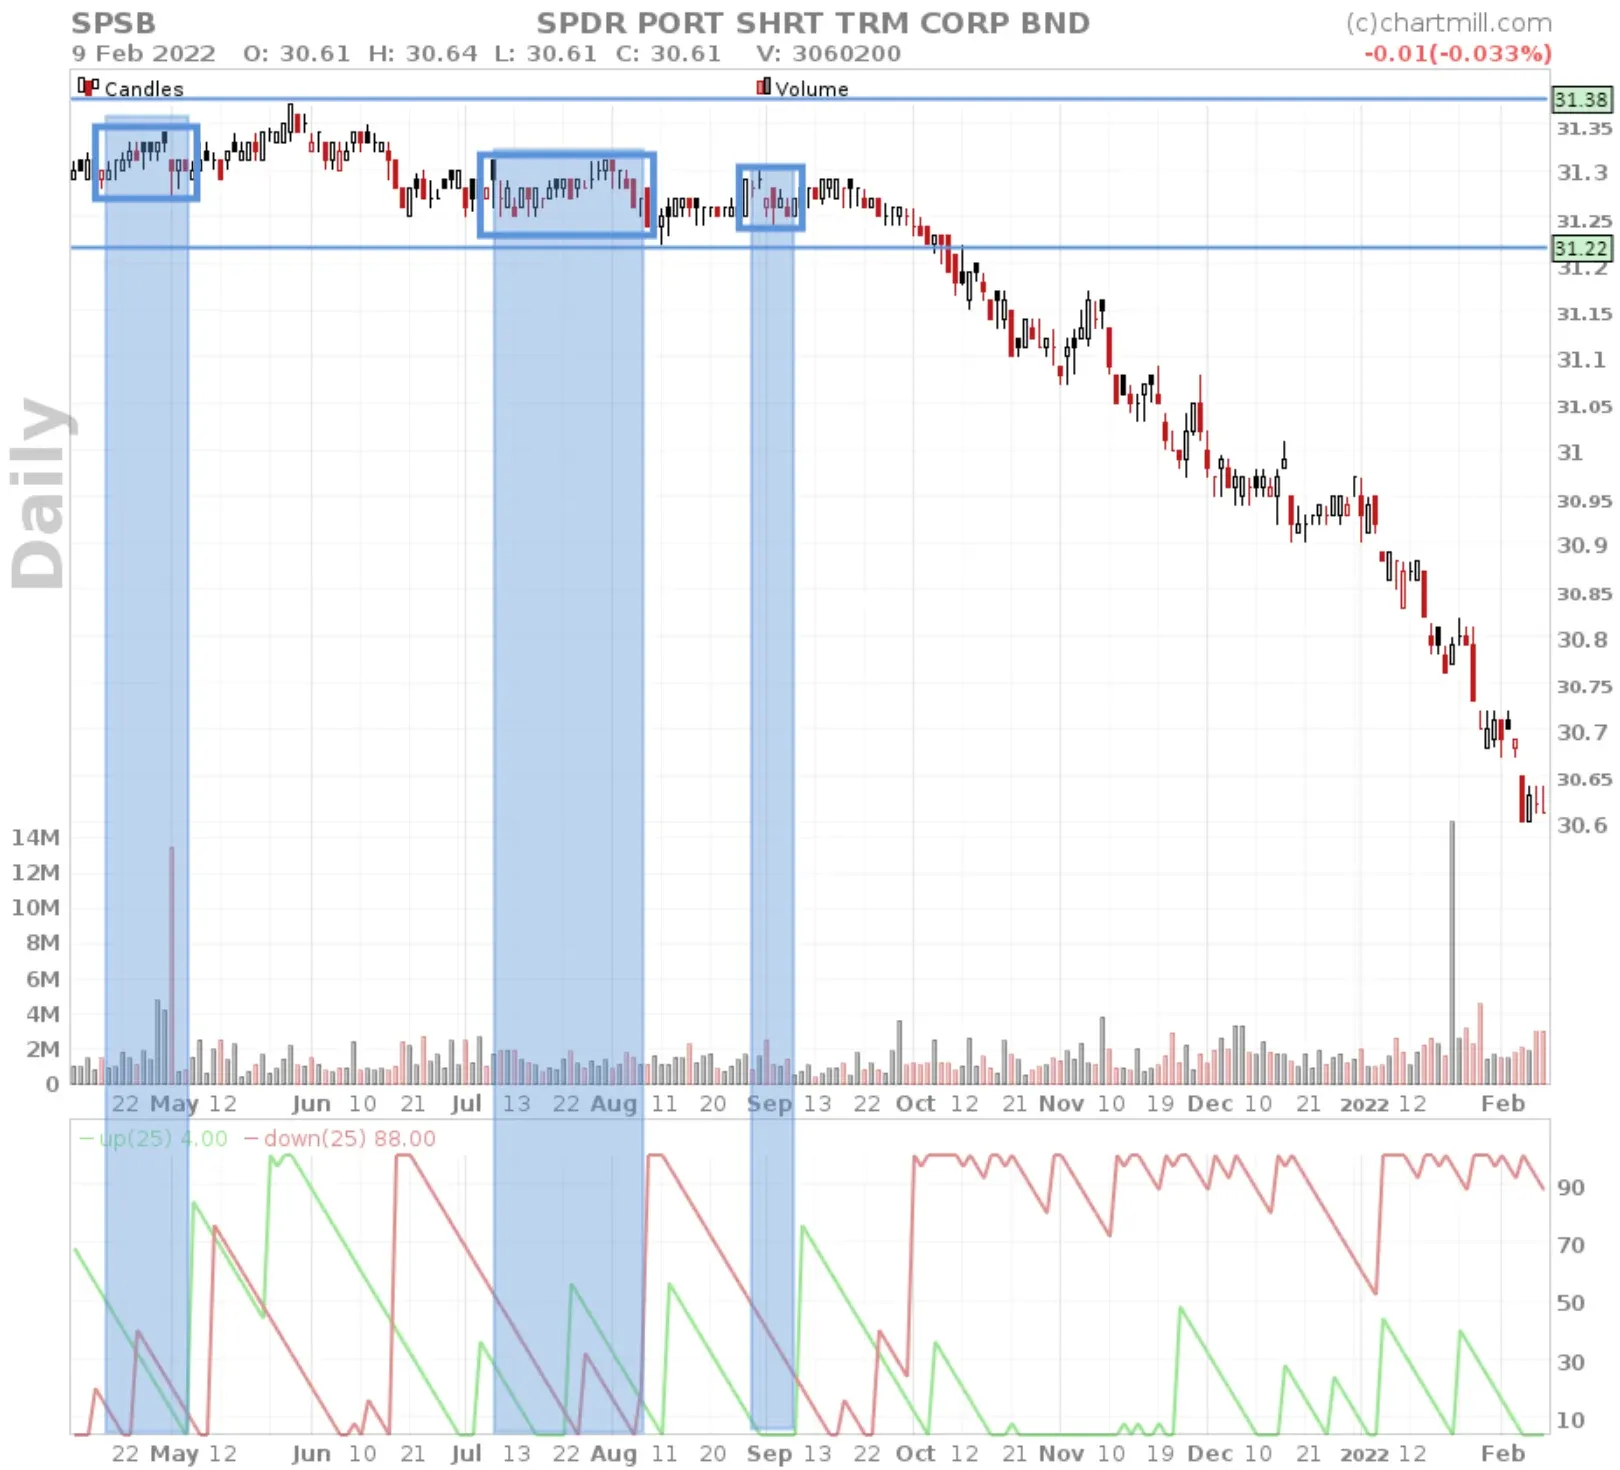
Another way that consolidating markets can be recognized is if both the Aroon-up and Aroon-down move down simultaneously and parallel to each other. This means that the time interval to both the most recent high and low increases simultaneously. This can only mean that the price is moving rather sideways.
Summary
The Aroon indicator is a versatile indicator that is quite unique as it focuses primarily on the elapsed time and compares it to the evolution of the stock price.
- An Aroon-up above 50 and Aroon-down below 50 presents a bullish picture, an Aroon-down above 50 and Aroon-up below 50 is bearish.
- An Aroon-up which is rising while the Aroon-down is falling means that a potentially bullish trend is forming.
- An Aroon-down which is rising while the Aroon-up is falling means that a potentially bearish trend is forming.
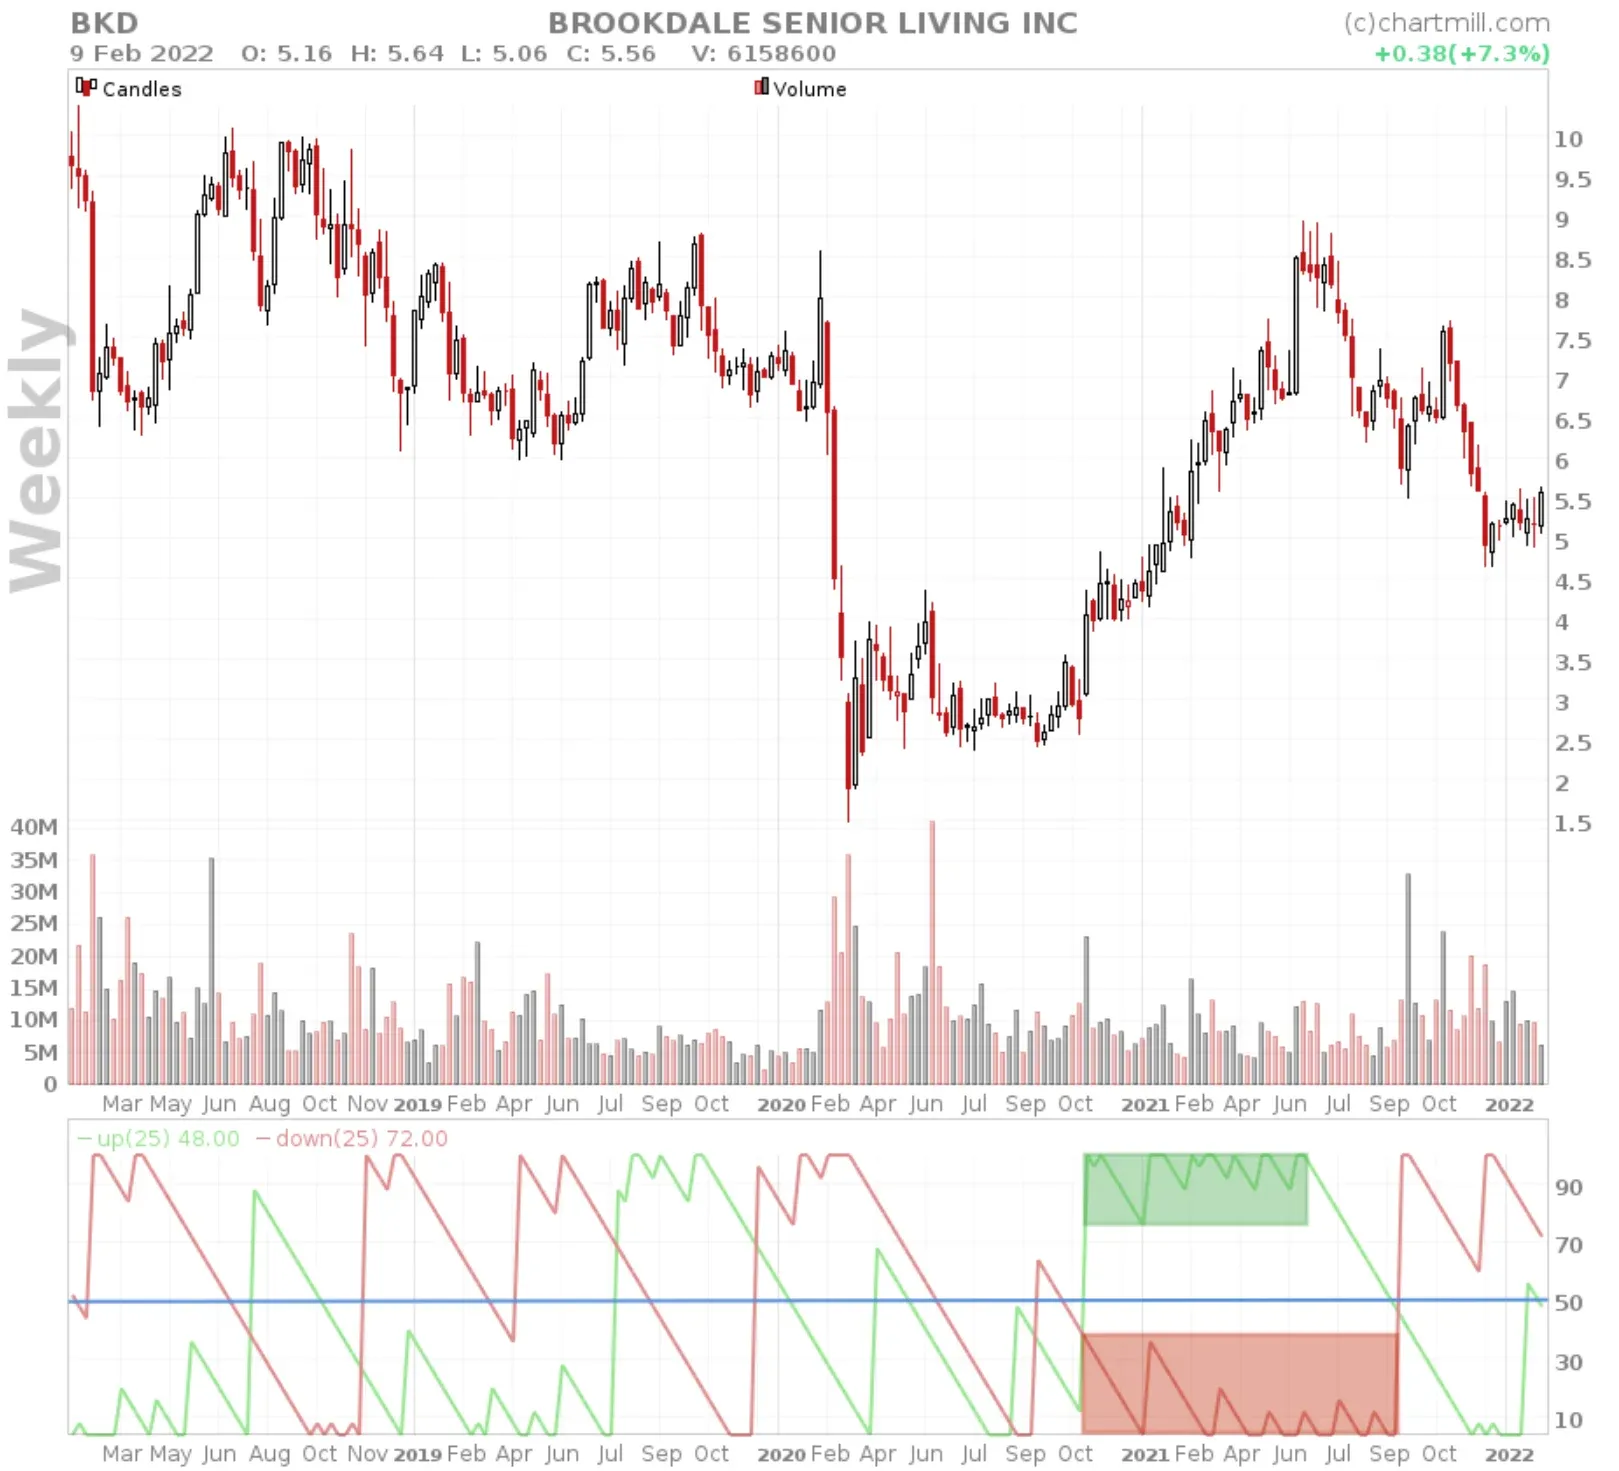
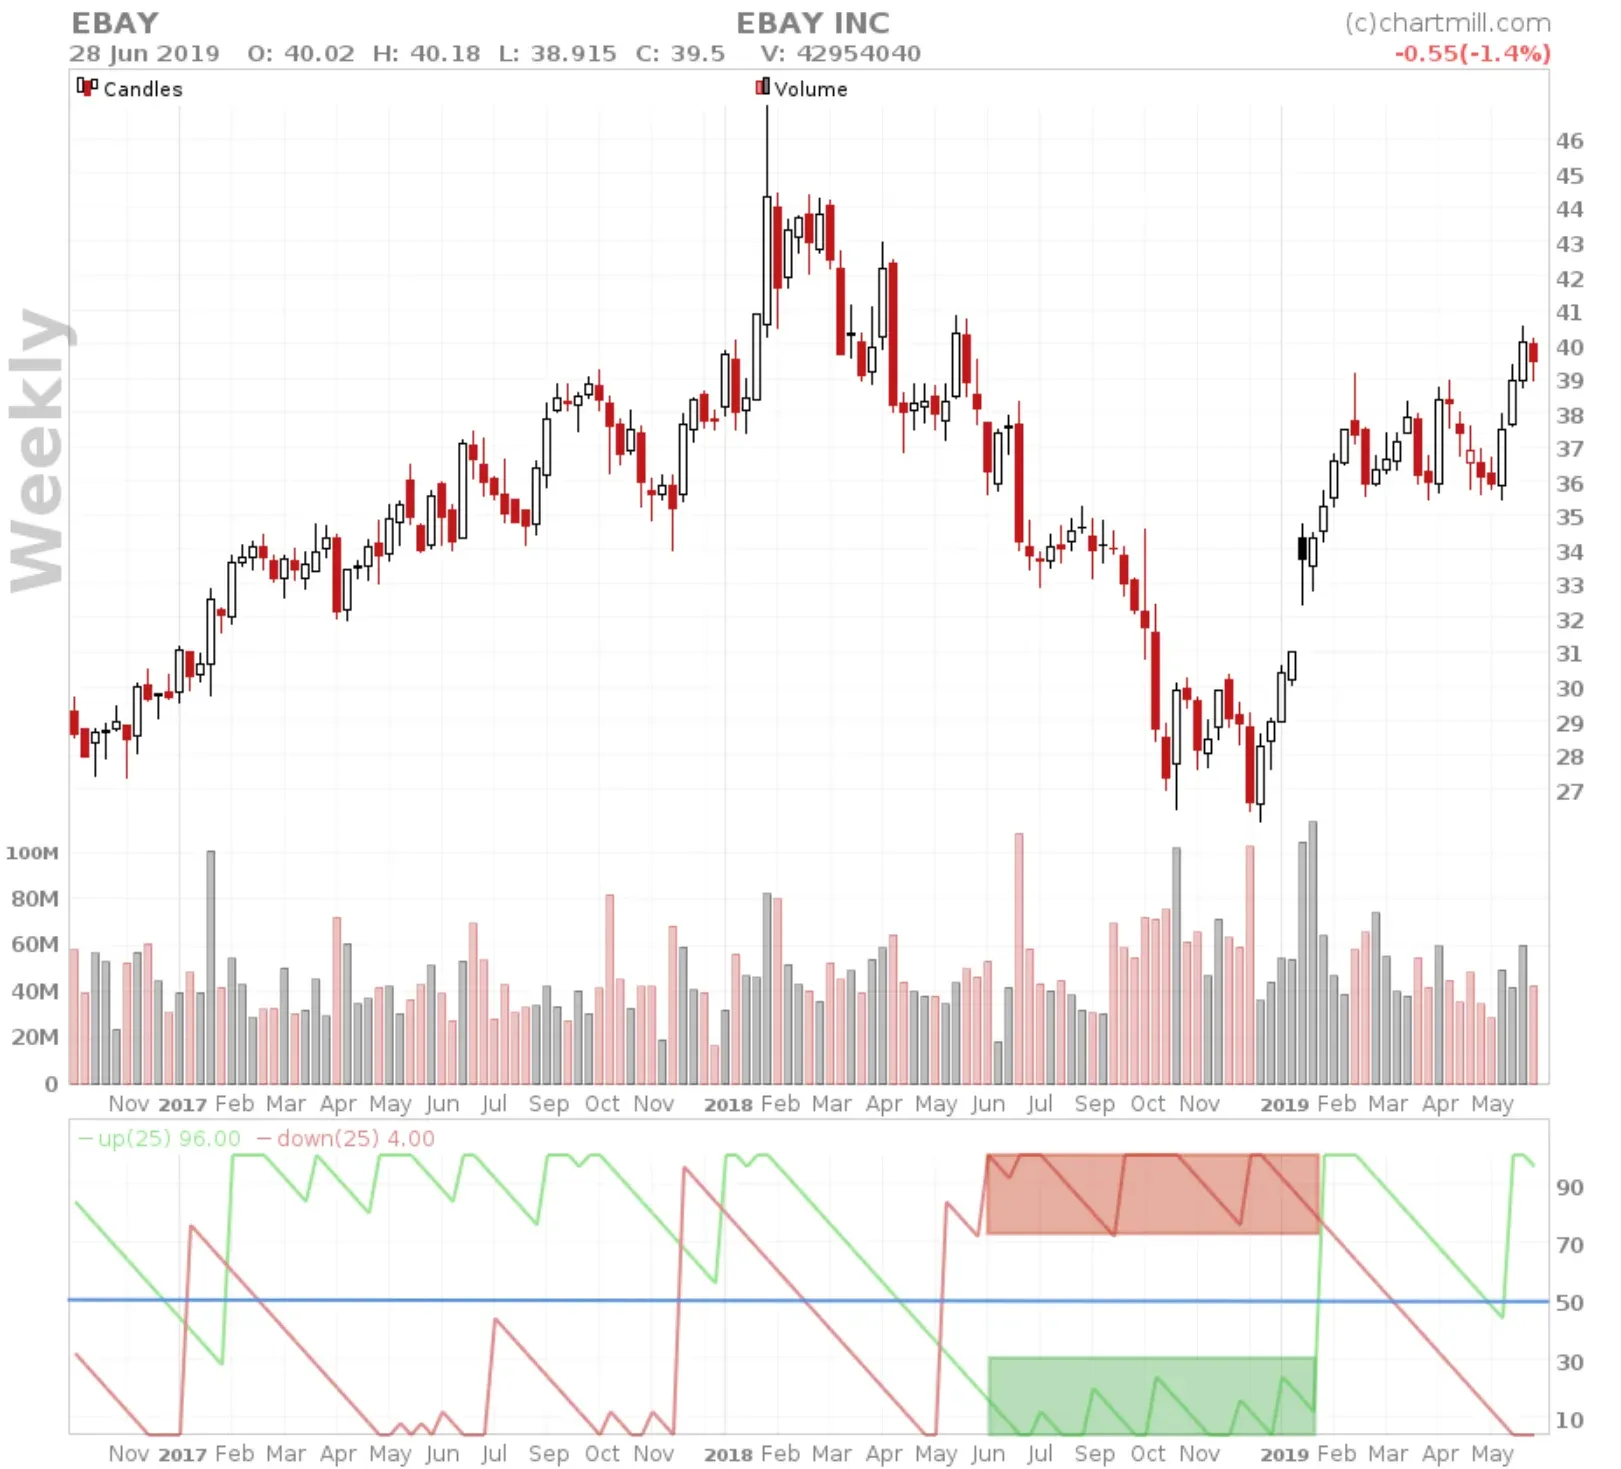
- An Aroon-up that holds very high values over a longer period is a sign of a strong bullish trend.
- An Aroon-down that shows very high values over an extended period is a sign of a strong bearish trend.
- If both the Aroon-up and Aroon-down are in the lower area at the same time, it is a sign of a sideways trend.
- An Aroon-up and Aroon-down running parallel to each other from top to bottom is also a sign of an incipient sideways trend pattern.
In the next article, I'll continue with the screen capabilities of this indicator in our stock screener and show you how this indicator is best used to help identify potential trading setups.