Keltner Channels
By Kristoff De Turck - reviewed by Aldwin Keppens
Last update: Apr 27, 2023
The Keltner Channel is a technical indicator used to measure volatility while it also generates buy and sell signals. The concept was first discussed in the book "How To Make Money in Commodities" (1960) by Chester W. Keltner, himself a trader in Chicago.
In this article
- Keltner Channel Settings
- Keltner Channel Formula
- How To Use Keltner Channel Indicator?
- Channel Breakouts
- Keltner Channels vs Bollinger Bands
- Keltner or Bollinger, which one to use?
- Squeeze Play Setup
- Conclusion
Keltner Channel Settings
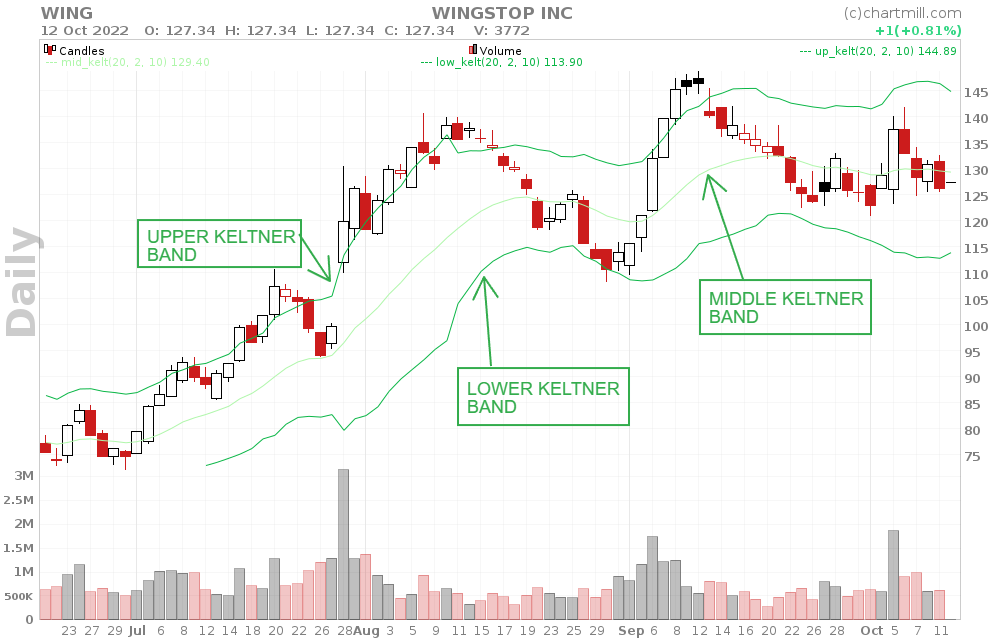
The keltner channel consists of three lines, the middle line of which is a 10-day moving average of the price (which in turn is the average of the highest, lowest and closing price).
And then, there is also an upper and lower Keltner line. Both are based on the distance between the highest and lowest prices (the average True Range) of the past 10 days on which a 10-day moving average is calculated.
Keltner Channel Formula
- Keltner Channel Middle Line = EMA
- Keltner Channel Upper Band = EMA + 2*ATR
- Keltner Channel Lower Band = EMA - 2*ATR
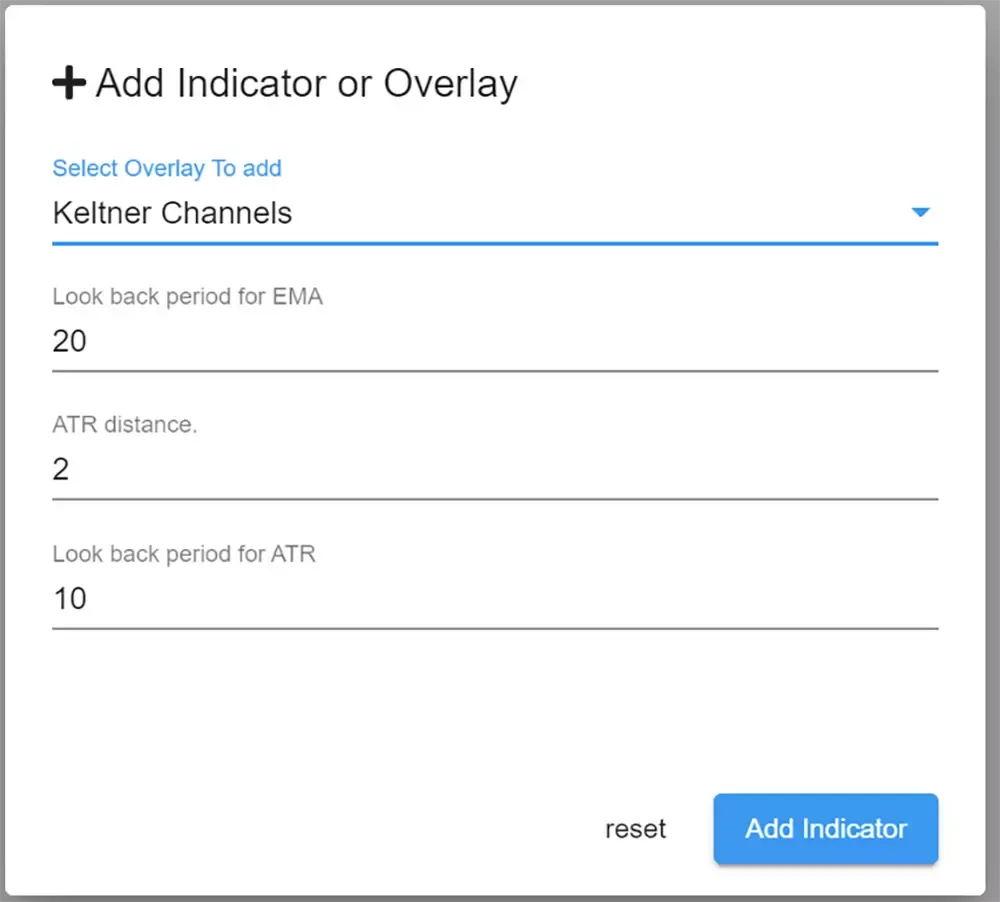
For this indicator, chartmill allows you to set both the 'look back period for EMA', the 'ATR distance' as well as the 'Look back period for ATR' separately in the indictor field.
How To Use Keltner Channel Indicator?
The most commonly known way of using Keltner Channels is in identifying price levels where the existing trend changes direction the moment the price breaks out of the channel.
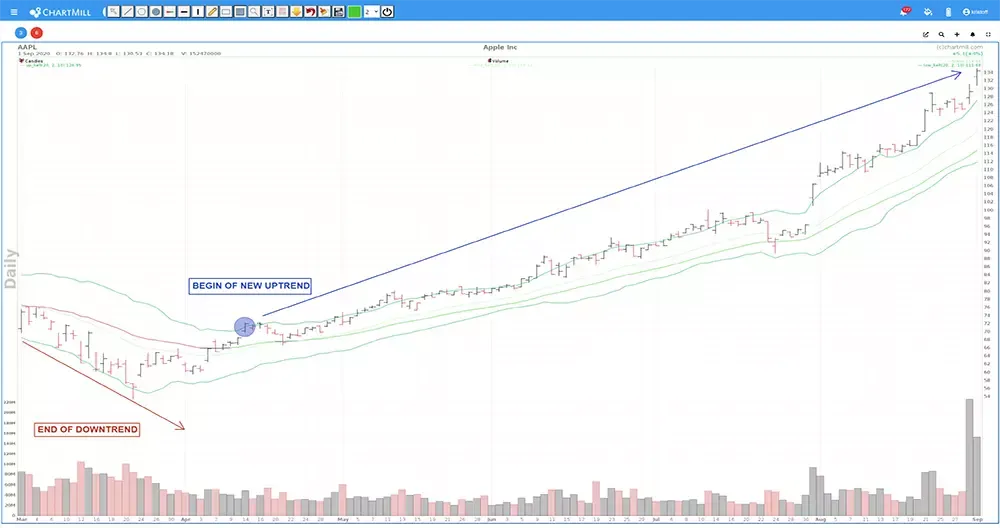
The chart above shows the Apple stock chart overlaid with the Keltner Channels. On April 14, 2020, the stock price rises above the upper Keltner band. This is the starting point at which the existing downtrend ends and a new bullish trend begins.
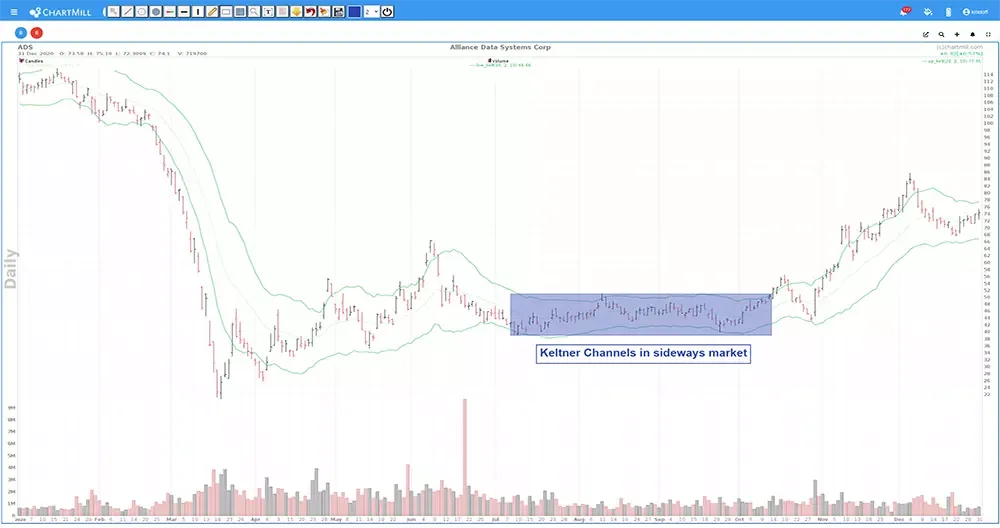
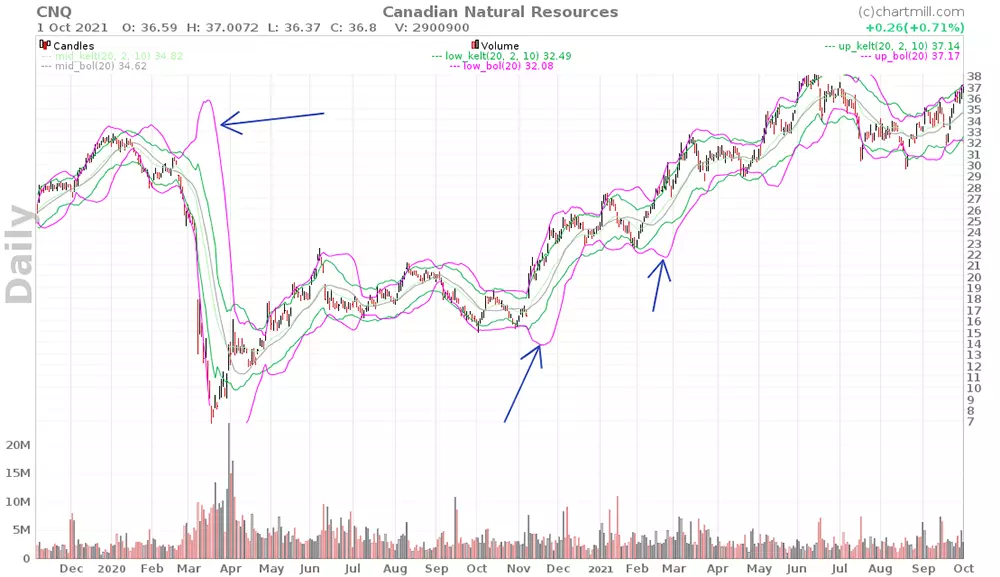
Another way this indicator can be used is for identifying overbought and oversold levels in consolidating markets.
As seen on the charts above, the Keltner Channel consists of three lines forming a kind of envelope. The middle line is a 20-day Exponential Moving Average (EMA), the two lines above and below this EMA are derivatives of the EMA to set the channel range. Setting that bandwidth is done through the Average True Range indicator (ATR).
By default, these channels are set to twice the ATR distance, above and below the middle EMA line respectively. Because the ATR indicator is used for this purpose, we can argue that the Keltner Channels are based on the volatility (the degree of movement) of the value to which they are applied. As a result, the channel width will become wider when volatility is high and narrower when volatility is low.
The EMA, which is based on an average of the price over a given period determines the direction of the channel, the ATR then determines how wide the channel is, taking into account the volatility of the EMA.
Channel Breakouts
Keltner Channels are good indicators to detect the decreasing strength of an existing trend and - by extension - the possible start of a new meaningful trend. It is not uncommon for trend changes to occur with a fair amount of volatility and thus pronounced upward or downward movements. Thus, when the price penetrates the upper line of the Keltner Channel (the actual 'breakout') after a previous downward trend, this is a first, important signal that the existing trend is weakening and there is a good chance that a new trend in the opposite direction is emerging.
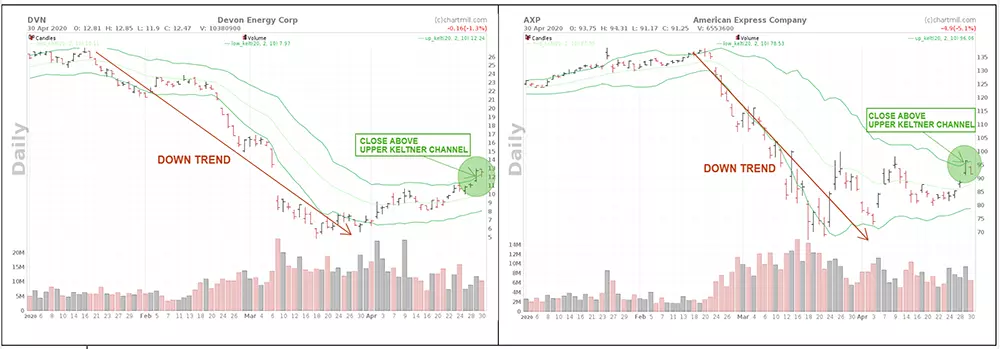
The same is true when the lower band is broken after a previous upward trend.
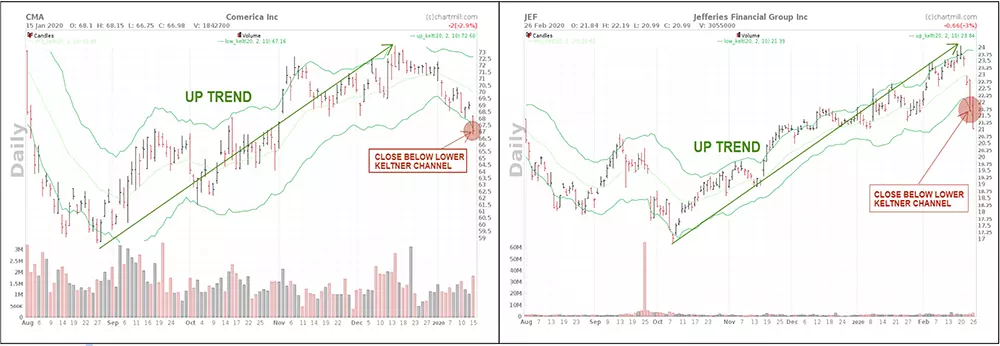
Please note that these are only indications that the existing trend is losing strength. The breakout in one of the two directions should not be interpreted as buy or sell signals as such. In many cases it will happen that the first strong counter movement in the existing trend does not continue and the price falls back. This creates the typical sideways ranges in which the price moves between the upper and lower Keltner bands.
Keltner Channels vs Bollinger Bands
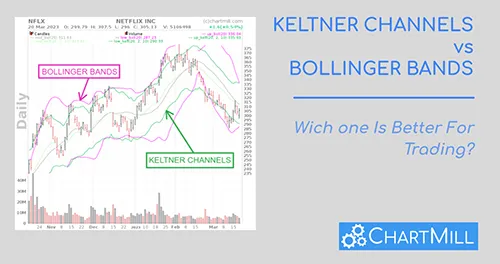
Although Keltner Channels just like the Bollinger Bands have many visual similarities and they are both trend following indicators the difference between them is significant.
The middle line for example, the Bollinger Bands indicator uses a Simple Moving Average (SMA) while the Keltner Channels use an Exponential Moving Average (EMA). The latter assigns more weight to recent prices and will therefore react a little faster to the latest price developments.
However, the biggest difference lies in the fact that for the upper and lower channel line an ATR-value of the EMA (Keltner Channels) is used while for the Bollinger Bands this is a standard deviation of the SMA. Because the standard deviation (2X) is somewhat more volatile than the ATR-value, the bandwidth will be less constant as far as the Bollinger Bands are concerned. This is especially noticeable if the price suddenly rises or falls sharply in a relatively short period of time.
purple : Bollinger Bands | green : Keltner Channels
Keltner or Bollinger, which one to use?
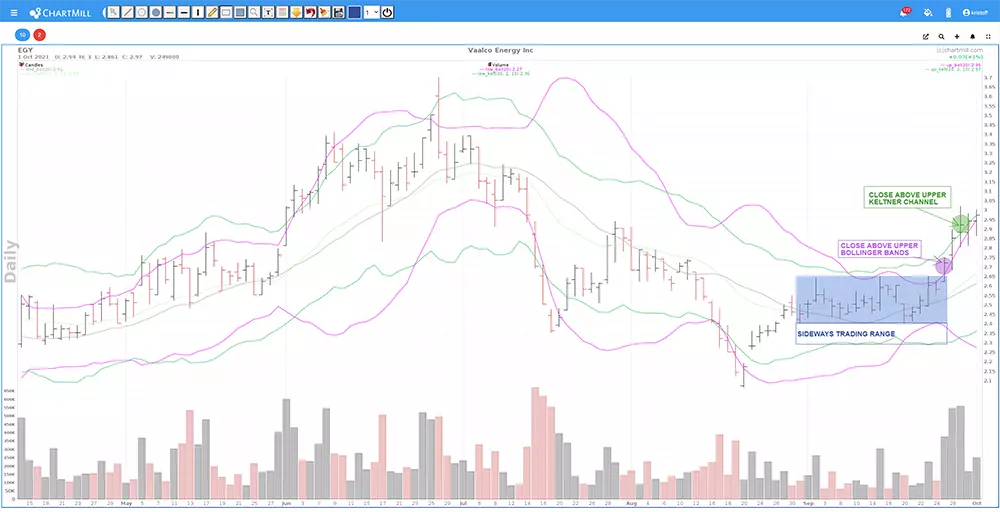
Just because Keltner Channels are slightly less volatile than Bollinger Bands, they are more useful for detecting long-term trend changes. The higher volatility of the Bollinger bands has the advantage that the bandwidth will narrow more quickly if the price movement is calm. As a result, it will be possible to react more quickly to breakouts from that sideways price channel.
The recent example below for the share Vaalco Energy Inc (EGY) shows the difference when both indicators are visible on one chart. The circles represent the time when the price closes above the upper band of the price channel.
Squeeze Play Setup
There are even specific trading strategies that use both indicators to determine where and when to enter the market.
A 'squeeze play setup' for example combines the use of Bollinger Bands and Keltner Channels. It occurs when the Bollinger Bands are inside the Keltner channels. When this happens, the stock has been trading in a narrow range for a while. A major move could happen when the stock breaks out of this trading range.
More information is available in the article "Finding Stocks Ready to Break Out of Consolidations with Squeeze Plays (Bollinger Bands and Keltner Channels)"
Conclusion
Keltner Channel is an indicator which attempt to visually represent the existing trend. However, it is - due to it's less volatile nature - somewhat better suited for determining the trend. Breakouts above or below the upper or lower Keltner Channel should be interpreted as warning signals that the existing trend is losing momentum rather than as direct trading signals per se.