Understanding the Fast, Slow and Full Stochastics
By Kristoff De Turck - reviewed by Aldwin Keppens
Last update: Apr 28, 2023
This is a follow-up to the first basic article around the Stochastic indicator. In ChartMill, there are 3 different variants available. The Fast ,Slow and Full Stochastic.
As a reminder from the first article, the stochastic indicator is a momentum indicator that represents the location of the closing price, relative to the highest/lowest range over a set number of periods in the form of a value between 0 and 100. The closing price is calculated by subtracting it from the lowest price in that period. The basis of the Stochastic indicator is the Fast Stochastic. Just an example to clarify.
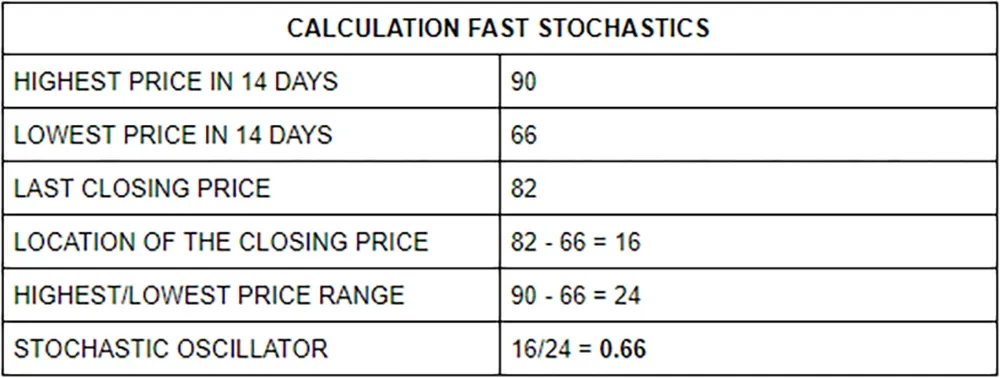
That 0.66 number represents the %K parameter in the the stochastic indicator. It is then multiplied by 100 to arrive at a round number. So in this case it becomes 66.
The chart below is from Amazon (ticker: AMZN) showing the Fast, Slow and Full Stochastics. Now for verification, as in the example above, let's manually calculate the Fast Stochastics for Amazon. See the table and chart below for more details:
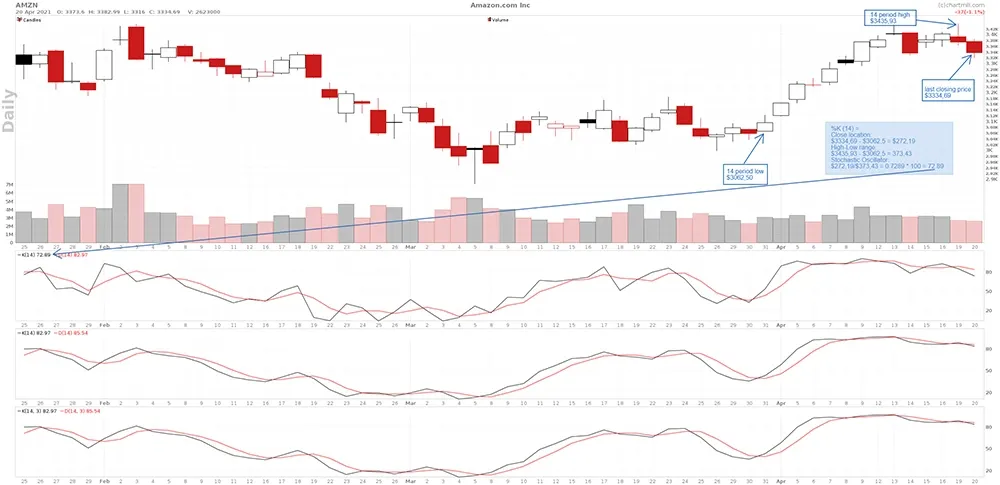
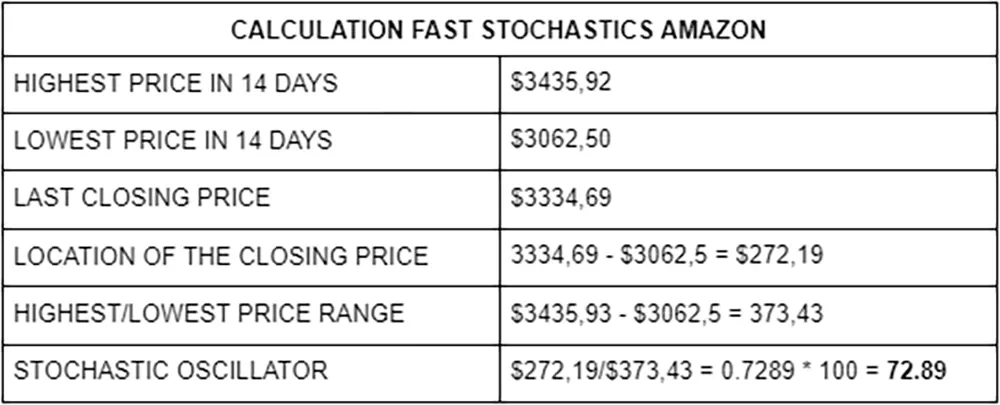
The result, 72,89 does match the value found in the upper left corner of the Fast Stochastic indicator (first indicator screen below the price chart).
The black line in this Fast Stochastics indicator is the %K line, the number 14 refers to the number of periods over which this indicator was calculated. The red line is a 3-day simple moving average of the black %K line. It is also the signal line (signal occurs as soon as the black line crosses the red line up or down).
The Slow Stochastic (middle indicator) takes the Fast Stochastic as a base and applies a 3-day simple moving average to it to make the black line less sensitive and thus flatten it a bit. The number 14 refers to the number of periods over which this indicator was calculated. You can clearly notice the difference when comparing the black lines between the Fast and Slow Stochastics. Again, the red line is the %D line which acts as a signal line and which is a 3-day simple moving average of the black line.
Finally, there is the Full Stochastics (the bottom indicator below the price chart). However, with the Full Stochastics - in addition to being able to change the number of periods (as with the Fast and Slow Stochastics) - you also have the option to change the moving average used. If you leave this unchanged, the default values 14 and 3 are applied, giving the same results as the Slow Stochastics. Again, 14 represents the number of periods and the number 3 is the 'smoothing factor', being an ordinary 3-day moving average applied to the standard black %D line from the Fast Stochastics.
In the example below I have displayed the Full Stochastics twice. In both cases the number of periods was kept at 14 but in the lower example of the indicator I used a 6-day simple moving average instead of 3. This has the effect of making the black %K line a lot less choppy and that also affects the red %D signal line because it is based on a 3-day simple moving average of the black %K line.
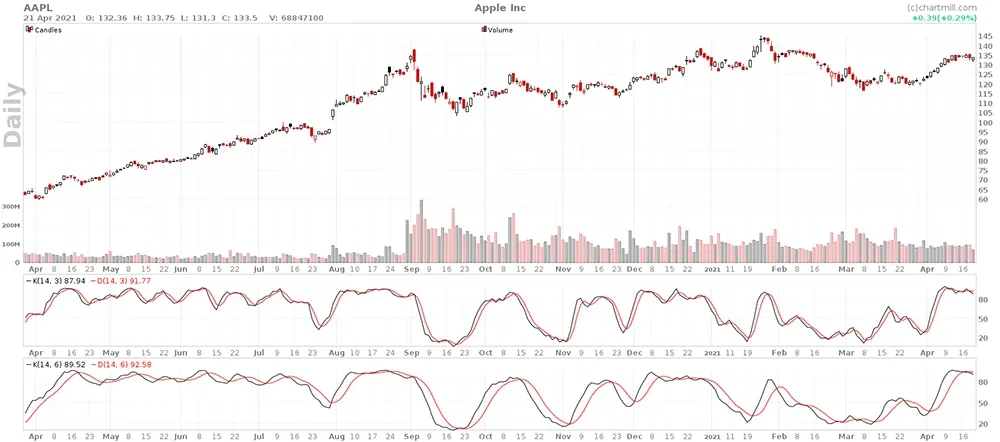
Thus, the Full stochastics allows to change the smoothing factor of the black %K line. This will also change the red %D signal line because it is based on the %K line. However, you cannot (yet) modify the value of the red %D signal line (based on a 3-day simple moving average of the black %K line) directly in ChartMill.
Which settings to use?
There is no such thing as the perfect settings as there are too many factors involved. What timeframe are you trading on? What is your investment style? Do you prefer more signals or perhaps just fewer?
To get an indication of the signals you get with different settings, I have reproduced below the daily chart of Amazon with below it four times the Full Stochastics Indicator, but each time with different settings.
The settings used are:
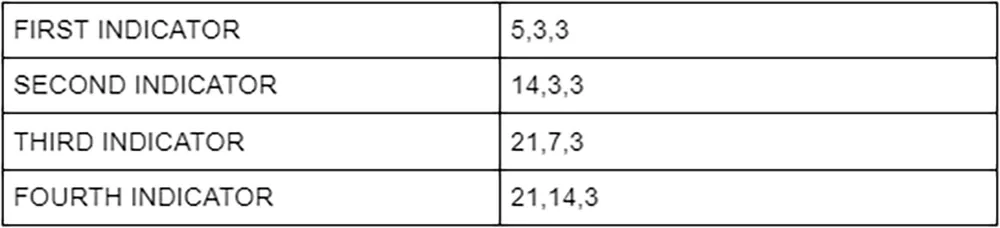
The first number is the number of periods over which the indicator is calculated. The second number is the smoothing factor applied to the first number. Numbers 1 and 2 together form the black %K line.
The third number forms the red %D line which is calculated by applying a 3-day moving average to the black %K line. This is the same for all variants used above because it cannot (yet) be adjusted in the ChartMill platform.
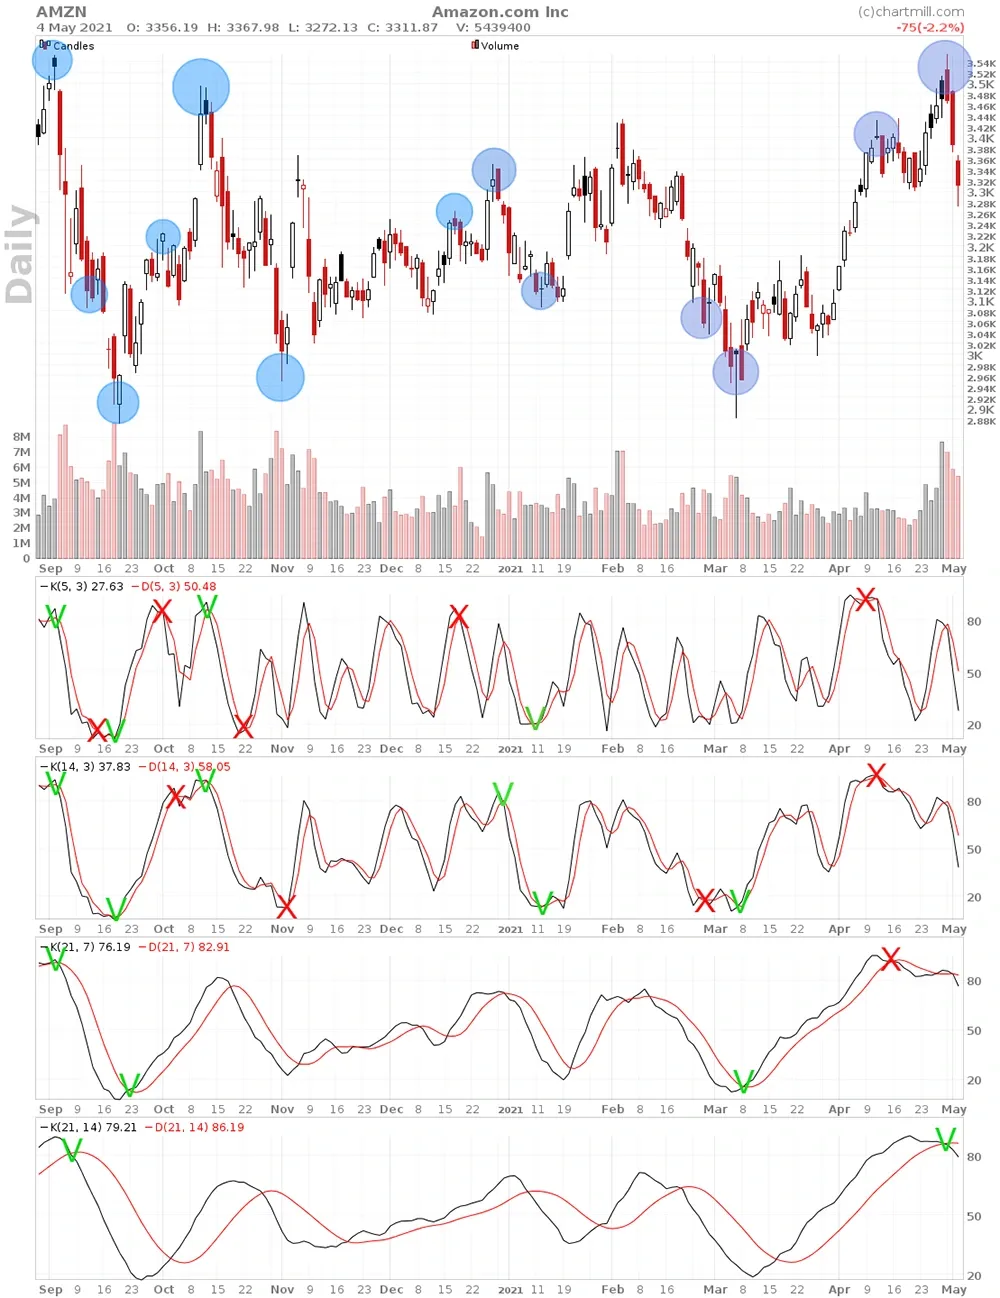
As a signal, we only withheld the crossings in the Stochastics indicator below the 20 or above the 80 level. These correspond to the blue dots in Amazon's price chart.
The general rule that shorter settings produce more signals is obvious. However, more signals are not always better. The upper indicator with the settings 5,3,3 may well produce 9 signals, but of these 9 there are 5 where the price reaction did not proceed as it should have done in order to be able to speak of a profitable trade.
In contrast, the bottom indicator with settings 21,14,3 yields only two signals during the same period but the potential gain at both signals was significant enough to be retained as a valid signal.
The default settings, 14,3,3 (second indicator below the price chart) yields 10 signals of which 6 can be retained as successful. The fact that these default settings produce more signals than the first indicator with shorter parameters is purely due to the fact that we only retained signals below 20 or above 80. If we consider all the crossovers of the red and black lines, the upper indicator does produce the highest number of signals.
The attentive reader may have already noticed that we are dealing with a stock that is moving in a very wide sideways range between $3500 and $2900. What if we used the same indicators in a stock that does show a very clear long-term trend?
The daily chart below is from Autonation Inc (ticker:AN), the blue line shows the 200SMA. In mid-July 2020, the stock price broke out above the $45 range and quoted above its 200SMA. Since then, the trend has been positive. We used the same stochastics indicator settings as for the first example. The only difference now is that the chart shows a clear upward trend. The signals that occurred during the period that the price was below the 200SMA have not been included.
Again, we have only retained the signals in the stochastics which occur below the 20 or above the 80 level. Because we are dealing with a clearly positive trend, we have only retained the buy signals, in this case the crossings which occurred below the 20 level.
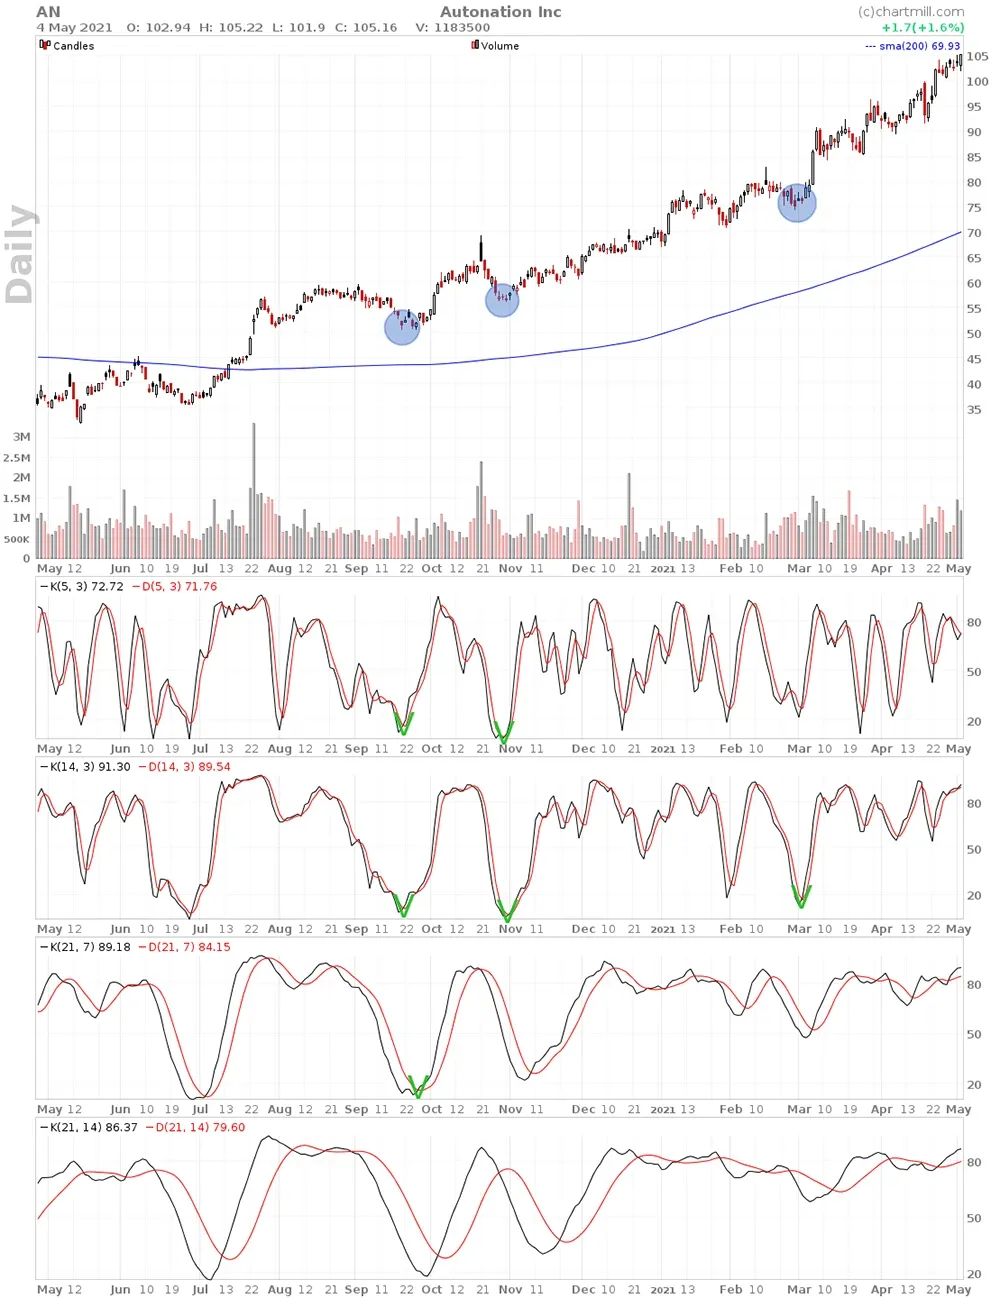
A few specific things that stand out:
- The lower Stochastics indicator does not give any buy signal and the Stochastics indicator above it (21.7.3) only one.
- The number of signals is also limited in the first two Stochastics indicators. As in the first example, we observe again that the default settings (14,3,3) delivers more valid signals (crossing below the 20 level) than the upper Stochastics indicator with the shortest settings (5,3,3).
Conclusion
We already knew that the way the Stochastics indicator can be used strongly depends on whether the price is in a sideways trading range, or in a rising or falling trend. The same seems to be true for the settings used. When the price is moving more or less sideways as in Amazon's first chart, slightly longer settings ensure that the largest number of false signals are filtered out. The few signals that remain do offer good opportunities.
However, we get a different picture if the price rises or falls over a longer period with limited drawdowns/retracements in between. In that case the shorter settings offer more opportunities with the condition that you only hold back the signals that occur in the direction of the prevailing trend. If in these cases longer settings are used you hardly get any signals and the indicator has little added value.
Based solely on these two examples the default settings (14,3,3) seem to give the best results but of course no price trend is identical. In both examples we have used daily charts. So experiment yourself on even longer or shorter, intraday timeframes and see what works best for your strategy.