The Smoothed Moving Average (SMMA)
By Kristoff De Turck - reviewed by Aldwin Keppens
~ 5 minutes read - Last update: Sep 29, 2023
Are you a trader looking to improve your technical analysis skills? If so, you've likely heard of the Smoothed Moving Average (SMMA) indicator.
This indicator is commonly used to confirm market trends and generate buy/sell signals. In this article, we'll explore the SMMA in more detail, including how it differs from other moving averages, how to calculate it, and some common trading strategies that incorporate the SMMA.
SMMA Definition
The Smoothed Moving Average (SMMA) is a combination of an SMA and an EMA. It gives the recent prices an equal weighting as the historic prices as it takes all available price data into account.
The main advantage of a smoothed moving average is that it removes short-term fluctuations, and allows us to view the price trends much easier, which is why they are widely used in trending markets.
Unlike the other moving averages discussed above, the oldest price data is never deleted when a new price is added to the calculation. So the oldest price data has a constant impact on the calculation, albeit minimal, due to a low assigned weight.
Even more than the SMA, the SMMA ensures that temporary fluctuations in price (also known as 'noise') are filtered out. In this way, the SMMA succeeds - better than the other MAs - in visualizing the prevailing trend.
The Way The Smoothed Moving Average Is Calculated
The first value is calculated as the simple moving average:
SUM 1 = SUM (CLOSE (i), N)
AND
SMMA 1 = SUM1 / N
The second moving average is then calculated as:
SMMA (i) = (smma1 * (N-1) + CLOSE (i)) / N
And the following formula is used to calculate the succeeding moving average periods:
PREVSUM = SMMA (i-1) * 1
SMMA (i) = (PREVSUM - SMMA (i-1) + CLOSE (i)) / N
Where:
SUM | sum,
SUM1 | total sum of closing prices for N periods (counted from the previous bar),
PREVSUM | smoothed sum of the previous bar,
SMMA (i-1) | smoothed moving average of the previous bar,
SMMA (i) | smoothed moving average of the current bar (except for the first one!),
CLOSE (i) | current close price,
N | smoothing period
Using the SMMA in a trading strategy
Long-Term Trend Signal
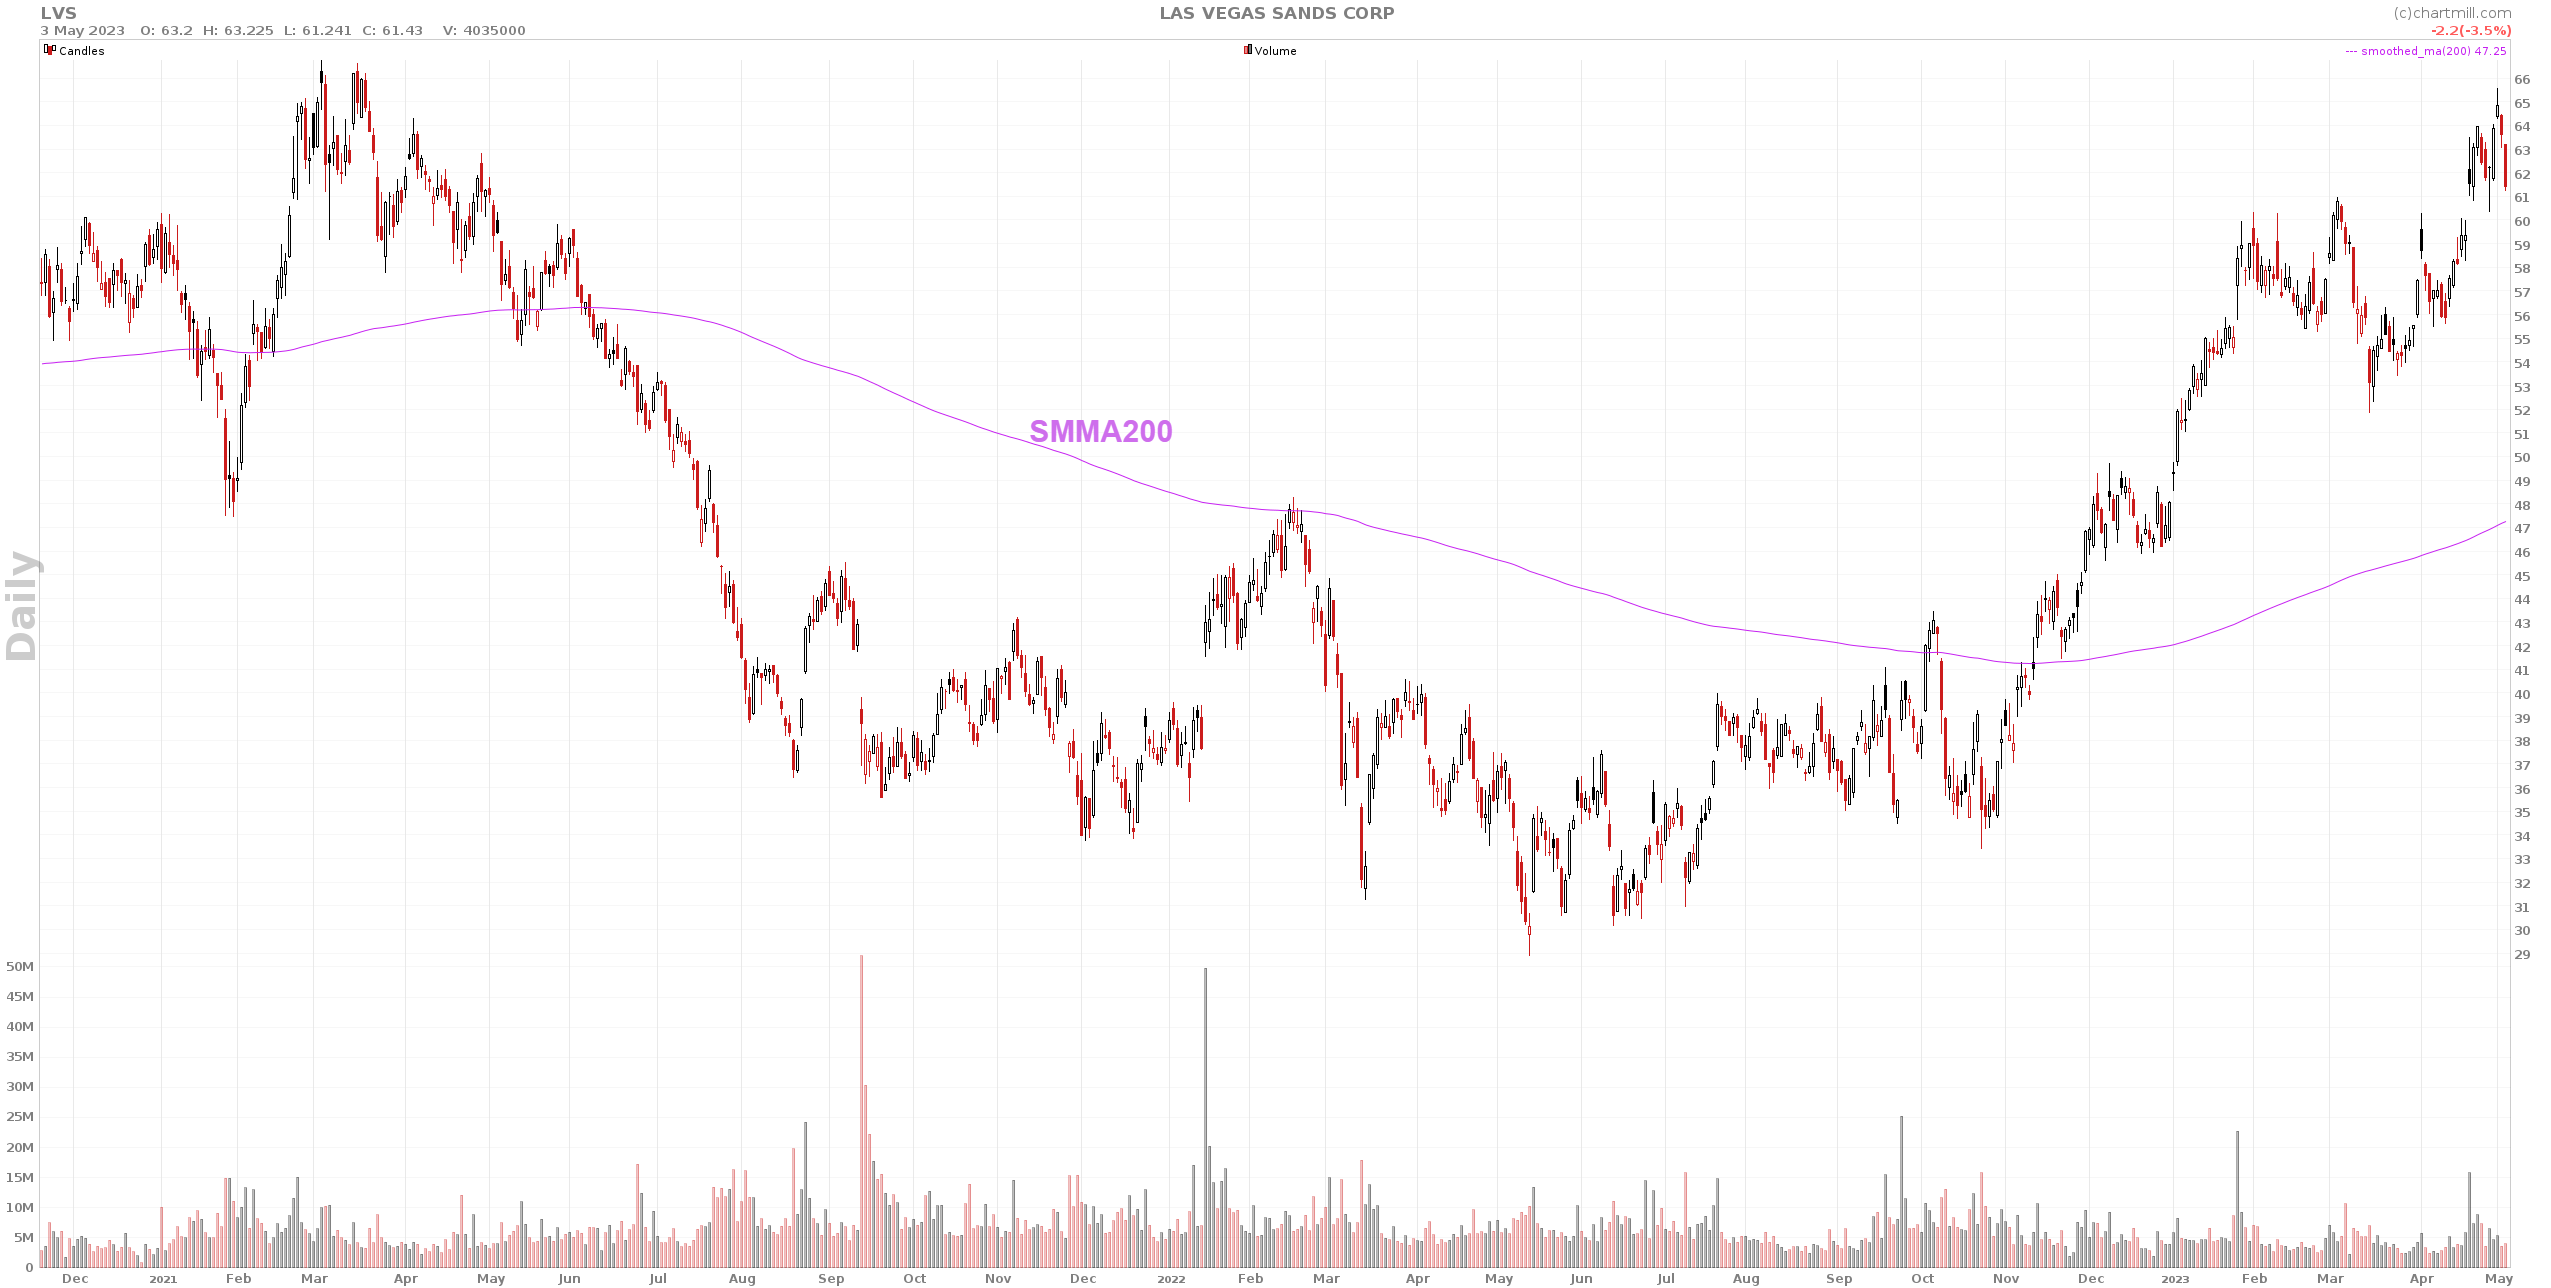
The SMMA, which has a much larger delayed reaction than the SMA and EMA, is ideal for those who mainly focus on the long term.
For example, position traders who base their investment decisions primarily on a company's fundamentals can use this type of moving average as a technical tool to determine a visual long-term price trend. A 100 or, for example, 200 SMMA on a daily chart accurately reflects the long-term trend of the stock.
If the price is below the SMMA200, the long-term trend is bearish. If the price is above the SMMA200, the long-term trend is assumed to be bullish.
In a trading strategy, you can use this long-term picture as a trend filter when taking positions. If the price of the stock is below the SMMA200, meaning that the long-term trend is downward, you could opt to stay out of the market. Only when the price quotes above the SMMA you'll consider opening long positions.
In this article 'How to Use Moving Averages to Determine the Trend?' you can read more on this subject.
Crossing SMMA’s
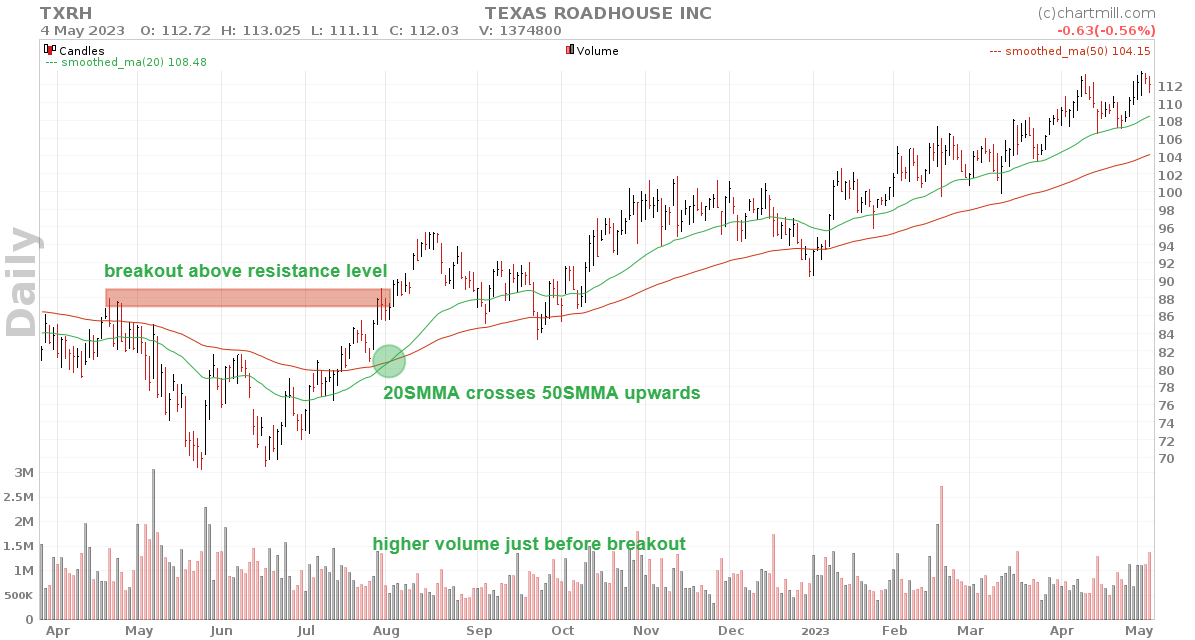
Another common application to generate trading signals is the crossing of a short-term SMMA with a long-term SMMA. If the short-term SMMA crosses the long-term SMMA upward, this is considered a buy signal. On the other hand, if the short-term SMMA crosses the long-term SMMA downward, this is a signal to close long positions (or perhaps open short positions).
A popular combination for position traders is the 20-day SMMA with the 50-day SMMA.
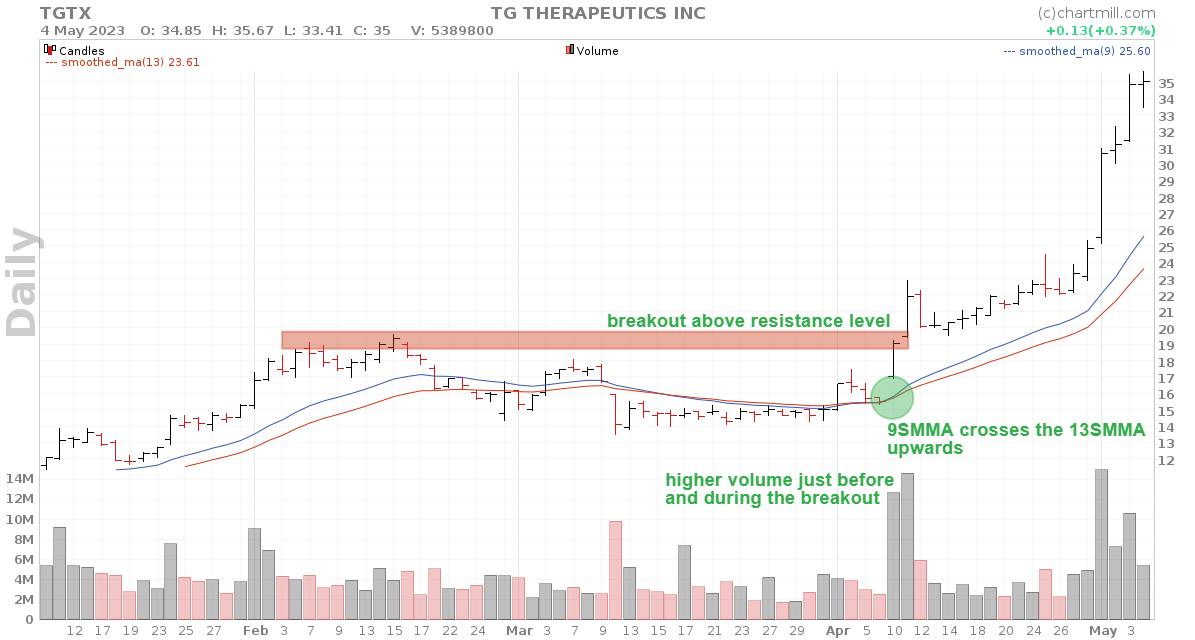
An alternative for those who prefer to trade on a somewhat shorter timeframe is the crossing of the 9-day with the 13-day SMMA.
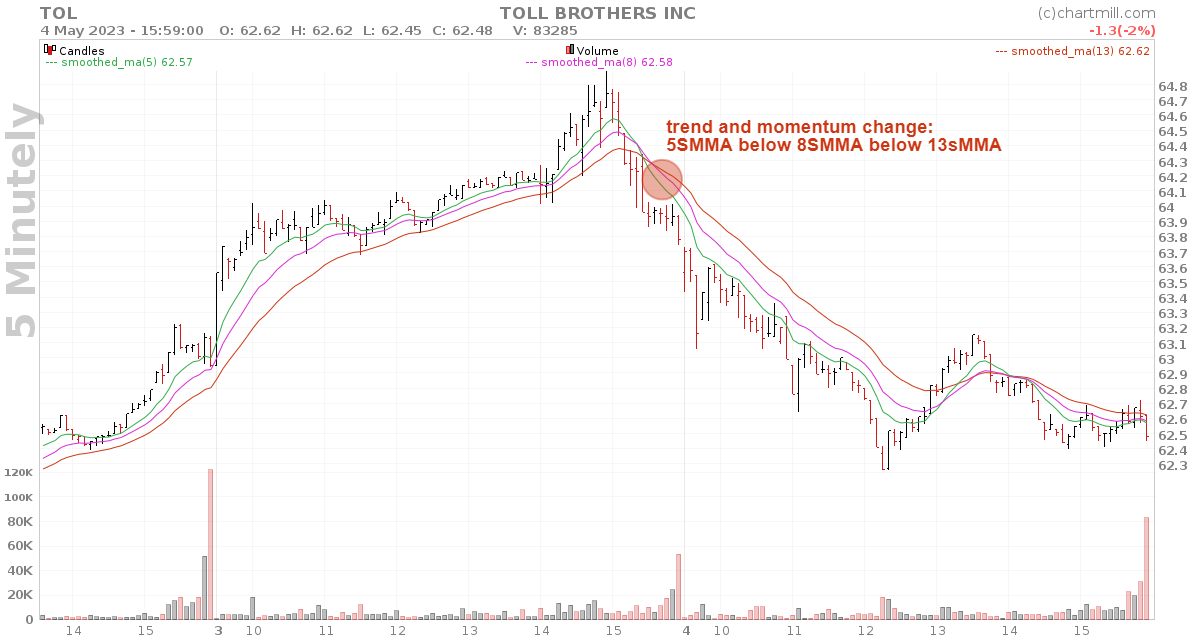
The most well-known crossing MA system for day traders consists of a combination of 3 MAs, the 5-day, 8-day, and 13-day MA. Below is an example with the 3/5/13 SMMA.
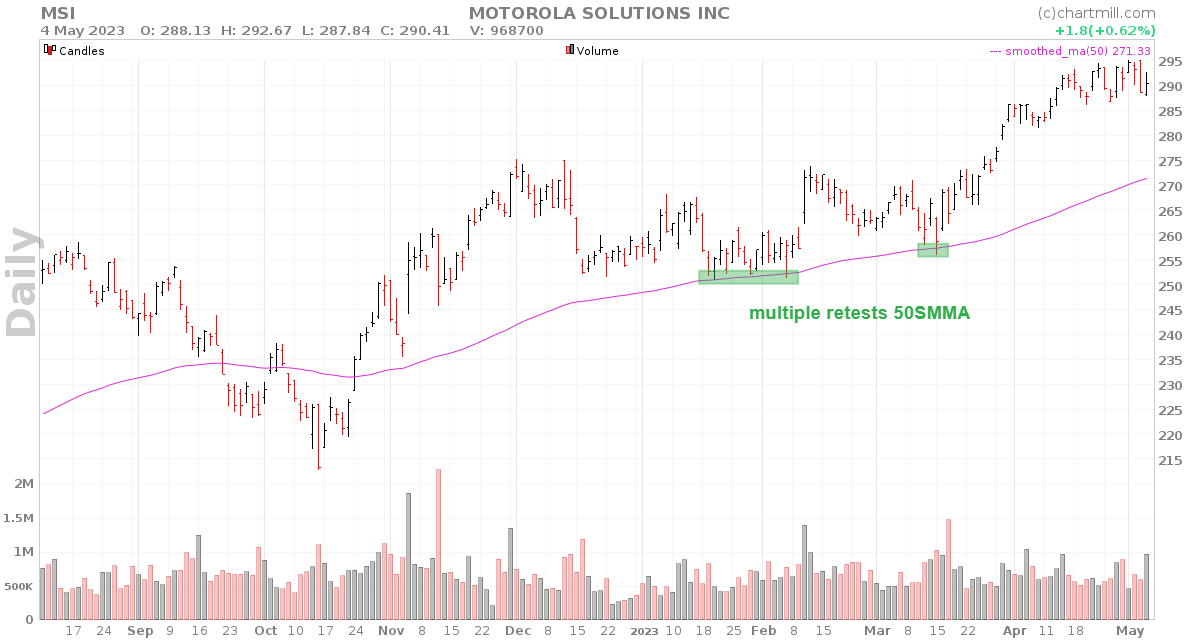
Using the SMMA as a support or resistance level.
As with other types of MAs, SMMAs are well suited to use as dynamic support and resistance levels. The 20, 50, and 200SMA on the daily chart are most commonly used for this purpose.
It is of utmost importance not to make trading decisions based on the SMMA alone. By combining it with other converging elements on the chart, you greatly increase its reliability.
Smoothed Moving Average vs SMA vs EMA
The SMA is the basic version of all existing MAs. Its calculation is very simple. Depending on the period set, the SMA will merely display the average price, with each period having an equal impact.
The EMA differs in the sense that it also calculates an average, but most recent periods are given more weight in that calculation. As a result, the EMA will react more quickly to sudden price changes. This MA is better suited for those trading on shorter timeframes. However, in volatile markets, this will cause EMA to give false signals more quickly.
Finally, there is the SMMA, which is closest to the EMA. The major difference with both SMA and EMA is that the calculation is not done on a fixed set period. The SMMA uses all available data, where - due to the specific method of calculation - all historical data is included in the final result. However, its influence becomes smaller and smaller as the period gets longer.
Thus, recent periods - as with the EMA - weigh more heavily than past price points. However, the specific calculation smoothes out its effect to a much greater extent. Thus, the SMMA will react somewhat faster than the SMA but still less sensitive to volatile price movements than the EMA.
In Essence…
-
The Smoothed Moving Average (SMMA) is a technical analysis indicator that can be used in trading strategies, such as as a long-term trend signal, a buy or sell signal at the crossing of multiple SMMAs, or as a support or resistance level.
-
It is a hybrid form of an SMA and EMA where the calculation is done based on a much longer period and where historical prices play a continuing role. However, their impact diminishes as time passes.
-
The SMMA leans most closely to the EMA in that more recent prices have more weight in the calculation (which is not the case with the SMA). Because of its specific method of calculation, the SMMA is slightly less sensitive to volatile prices than the EMA. This makes the SMMA an ideal indicator for swing traders.