The Exponential Moving Average (EMA)
By Kristoff De Turck - reviewed by Aldwin Keppens
Last update: Sep 29, 2023
In this second article I will discuss the Exponential Moving Average. This is one of the three different types of moving averages available in the ChartMill stock screener, which are :
- Simple Moving Average (SMA)
- Exponential Moving Average (EMA)
- Smoothed Moving Average (SMMA)
How are they being calculated, what are their properties and what kind of moving average is being used for what purpose?
As already stated in the first article, a moving average (MA) is a technical indicator that accumulates price points of an instrument over a given period of time and divides them by the number of points, creating a single trend line.
The Exponential Moving Average (EMA) - Definition and Formula
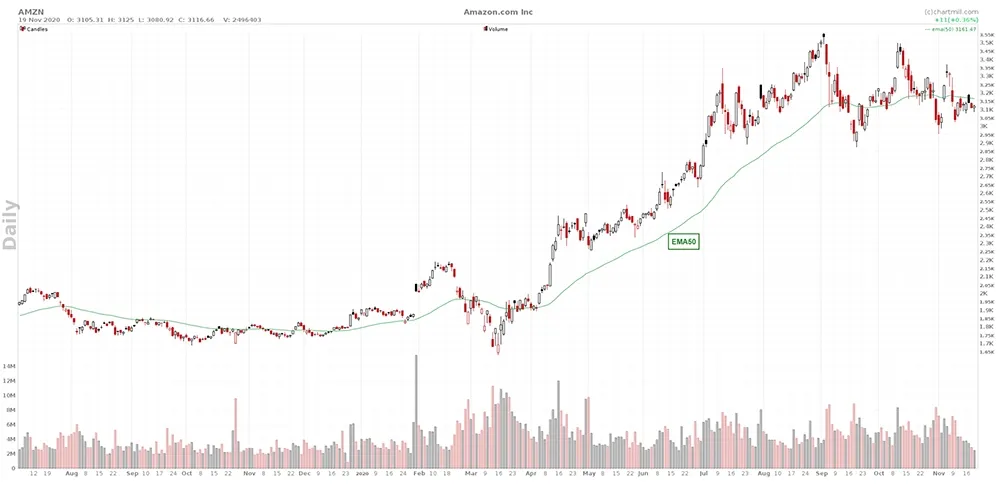
The EMA, the exponential moving average, gives more weight to recent prices than a simple moving average. The value of the EMA will therefore be more influenced by the more recent values. An EMA reduces the effect of the lag that comes from using previous price data and can help you identify a trend earlier, which makes it a much more suitable indicator for short term traders. The disadvantage is that the signal can be too early and that the movement only appears to be an intermediate 'spike' in the existing trend, causing the signal to be false.
EMA Formula
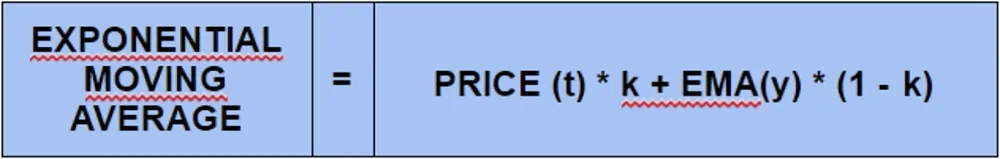
where :
- t = today
- y = yesterday
- N = number of days in EMA
- k = 2/(N+1)
How to use the EMA?
The EMA is the best choice for those who like to trade on shorter (intraday) timeframes, such as day traders. Due to the fact that this moving average reacts faster to recent price movements, it can be used as a base signal if the price is above or below the moving average.
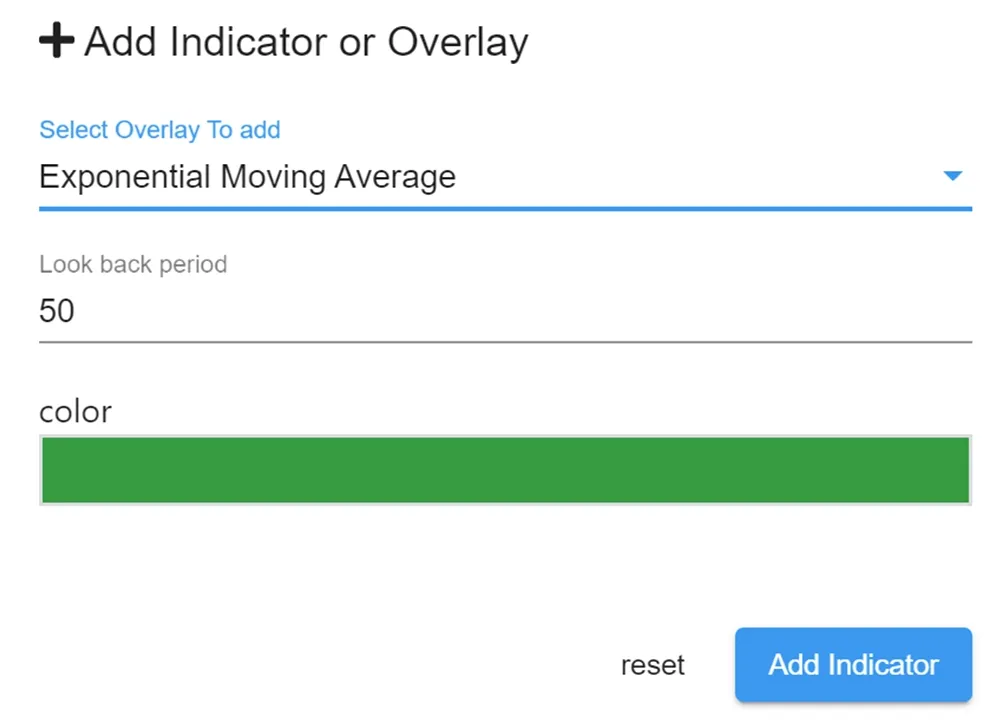
Adding an EMA to your chart
In the StockCharts menu, click on the plus sign and choose 'select overlay to add', scroll down to the Exponential Moving Average.
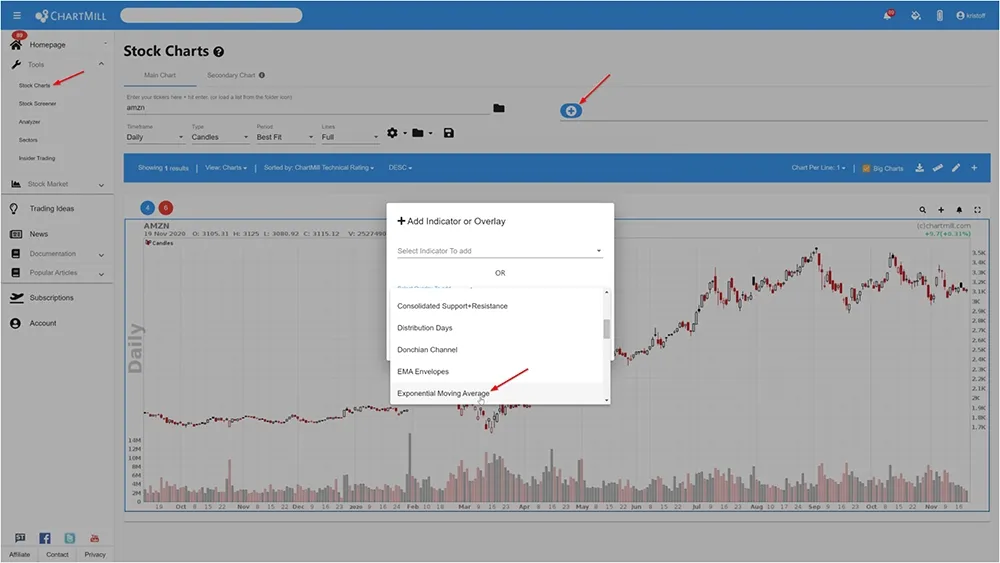
Next, select the 'Look back Period' and choose an appropriate color.