Adjusting Basic Screening Filters To Find The Best Momentum Movers
By Kristoff De Turck - reviewed by Aldwin Keppens
Last update: Apr 27, 2023
Trading Ideas
Following the trading ideas we post on our instagram account, we regularly receive the same question. How do we find these setups? What screens are used? Is this meant for the short or the long term? ....
An answer to some of these questions can be found in this previously published article and accompanying video which explains more in detail the specific basic screen that is used for the Instagram momentum setups.
In this article I will elaborate on this and a number of other screens that you can use to find qualitative momentum setups and I will go over a number of tweaks that allow you to fine-tune the screens so that they fit your personal situation even better.
The screens which will be discussed are generally meant for a typical momentum swing trading strategy where the positions are held for a minimum of 2 to a maximum of 5 days, if necessary also taking into account existing resistance or support levels, depending on the position which was opened (long or short). The reason for this is that pure momentum is something of relatively short duration, the idea being to profit from the strongest part of the movement and close the position before the momentum has completely disappeared.
Momentum stocks are also interesting for the typical intraday investor just because of the high volatility. As a daytrader, you want stocks that move higher than average. Stocks that quietly bobble sideways within a narrow price range are something you definitely want to avoid. Your working capital is held hostage and the potential profit on a daily basis is too small to be lucrative.
As a reminder…
Before I go over a number of different momentum screens, I'd like to emphasize once more the fact that selection is only one part of a successful trading strategy. Closing 7 successful trades in a row which yield you 2% on your trading capital on each trade, doesn't mean a thing if you lose more than 20% on your 8th trade. The way you determine your risk based on your position size and the way you deal with losing trades are to a large extent determining factors for your final result.
Being successful as an investor doesn't depend that much on which kind of strategy you're handling, whether you're a purely fundamental investor, focused on the long term or a swing or day trader, purely occupied with price action and technical analysis. All these strategies can be profitable as long as you manage to control the risk involved. A fundamental investor with a portfolio of 20 shares which each make up 5% of the total port can perfectly afford not to use a stoploss when entering a new position due to the diversification and position size within the portfolio. If the value of one individual stock were suddenly to drop to zero, it would 'only' mean a loss of 5% on the total portfolio. That is totally different from a daytrader who uses a large part of the available capital in one position. If in this situation the price suddenly drops sharply the impact on the portfolio is very significant if there is no hard stoploss provided to cut off the loss in time.
In this article series, written by one of the founders of ChartMill, this issue is discussed in more detail. Absolutely worth reading!
The Momentum Screens
A number of standard momentum screens can be found in the left main menu under the 'Stock Market' tab. I go over some of them in detail and give some suggestions for further fine-tuning.
New 52-week high (low)
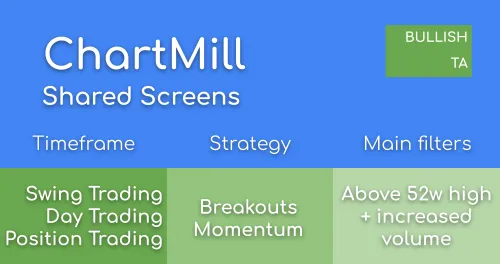
This screen serves as the basis for the tradingideas you can follow on our instagram page. By default this screen consists of only three individual filters :
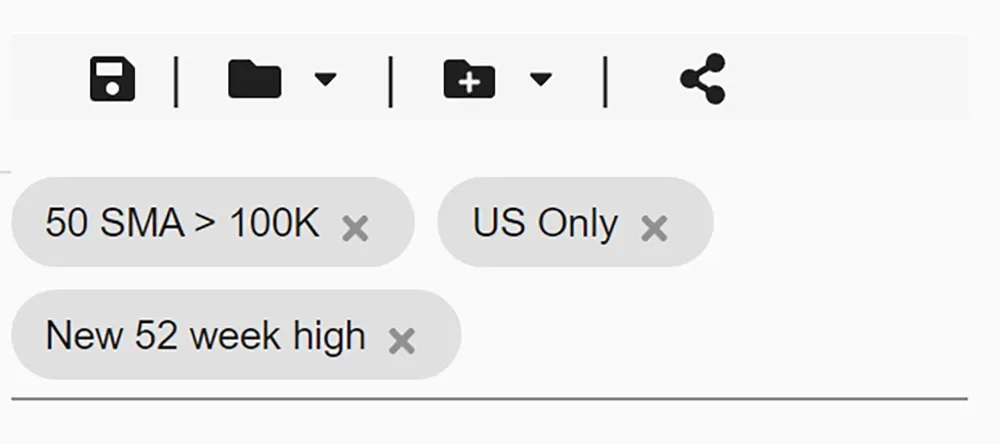
This filter shows all US stocks with a minimum volume of 100,000 and a new highest 52-week price. To make it a real momentum screen I add a volume filter. You can start with the option '100% more volume than the previous volume'.
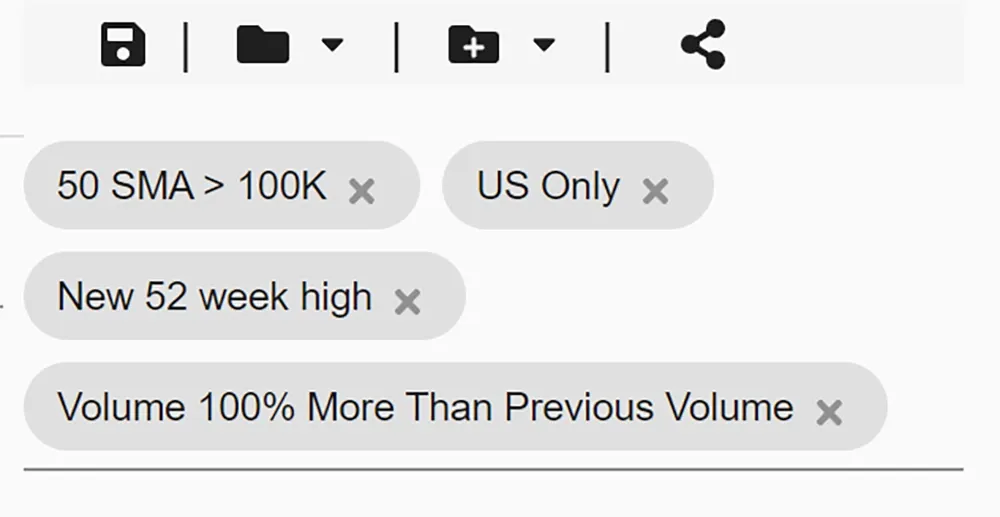
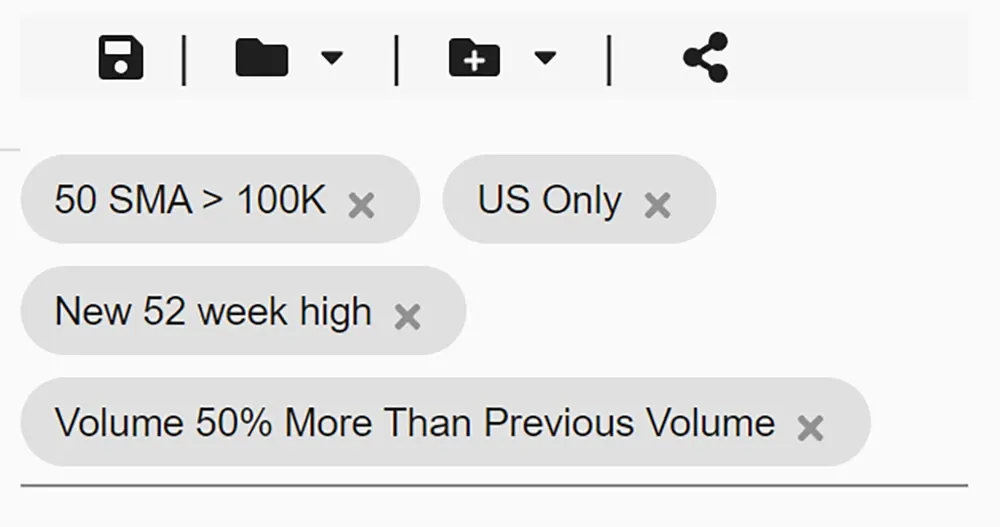
This one additional filter will drastically reduce the number of shares that qualify. If the number of contenders is too low, you can choose to make the volume filter a little less strict and set it to '50% more volume than the previous volume'. This ensures that more shares meet the volume requirements. However, only do this if you can't find good setups with the stricter volume filter.
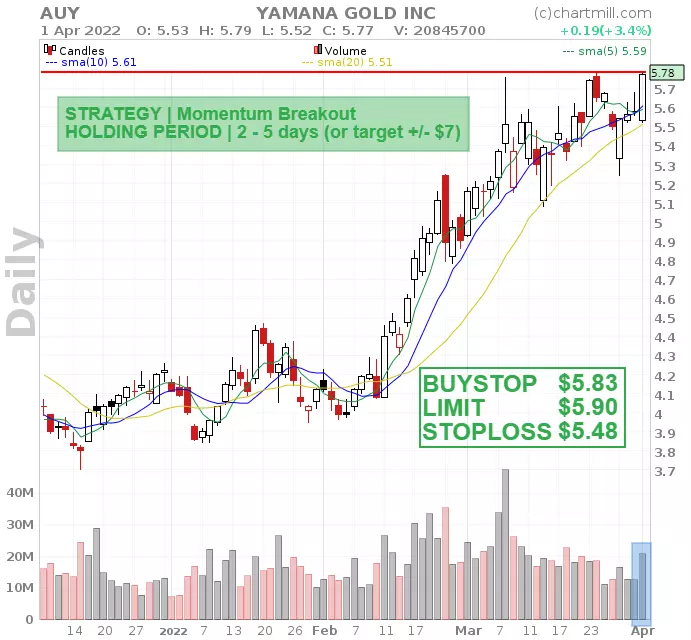
As a matter of fact, while we were writing this article, based on the above filter, the ticker AUY was retained as a momentum setup and shared via Instagram.
The most frequently made comment about this screen is that this filter only shows results where the price has already effectively broken out. The related question is whether it would not be possible to show a screen where the break-out is imminent but has not yet actually occurred....
In this article, I will not enter into the discussion of which method is the best. This depends to a large extent on what your own experiences and style are anyway. In any case, the setups already posted on Instagram are proof that going long with a stop limit order above the high of the effective breakout candle can certainly be effective.
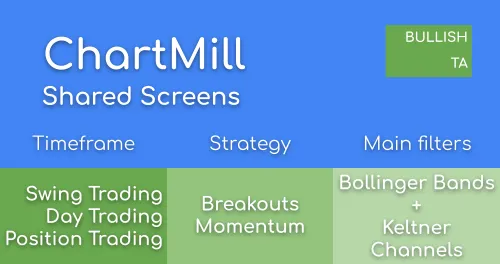
In any case, adjusting the filter so that the breakout has not yet occurred is certainly possible. This screen for example is a modified version where the basic filters and the specific volume filter has remained the same but where I have added a signal filter via the 'performance' tab. More specifically the option 'within 5% of 52-week high'.
With this additional filter you will only be presented with the shares whose price is quoted at less than 5% of the highest 52-week price. Would you like to make this percentage even smaller? That is also possible but you will have to create a custom expression via the 'Custom' tab. How to make custom expressions is dealt with in this video which is part of the Trading Academy Series (start at 01:35).
(In the video accompanying this article, I show how to create such a custom expression.)
For example, in this screen I have made sure that only the stocks that are quoted at a maximum of 2% of the highest 52-week price are retained. In order to make sure that the high of the last candle does not itself show the highest 52-week price, I have set an additional filter which determines that the current high price has to be lower than the 52-weeks high.
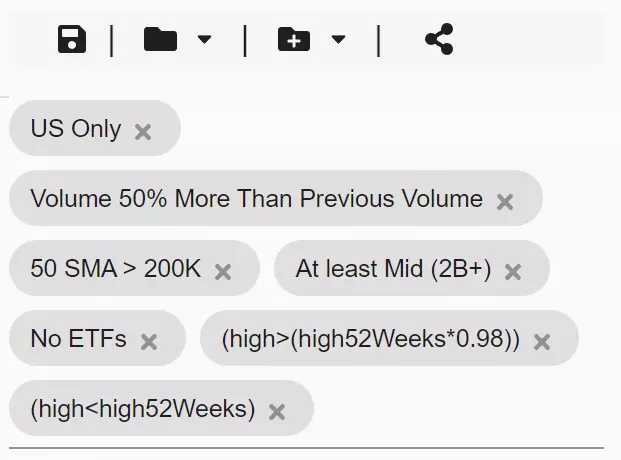
Other additional or modified filters:
- Average Volume: 200,000
- Market Cap: minimum 2B+
- No ETFs
These last two filters were added to filter out the somewhat smaller stocks and ETFs.
(The video accompanying this article shows how this screen is created.)
Are all these results perfect setups? Of course not! This remains a first basic selection from which you can further filter manually. We are mainly looking for stocks that tend to move sideways, close to their 52-week high and where a possible break-out could occur. The filter that specifies that the volume has increased significantly compared to yesterday is in any case already a good indication that there is definitely some interest in this stock.
Top Gainers and Losers
This is another screen filter that is great for tracking momentum stocks. Especially in combination with the Chartmill Technical and Setup Rating filters, you usually get to see some nice candidates that are worth monitoring further.
As the name itself indicates, this filter concentrates on the best and worst performing stocks on a daily basis. The result is shown in a table. Click on "Full List" (Top Gainers).
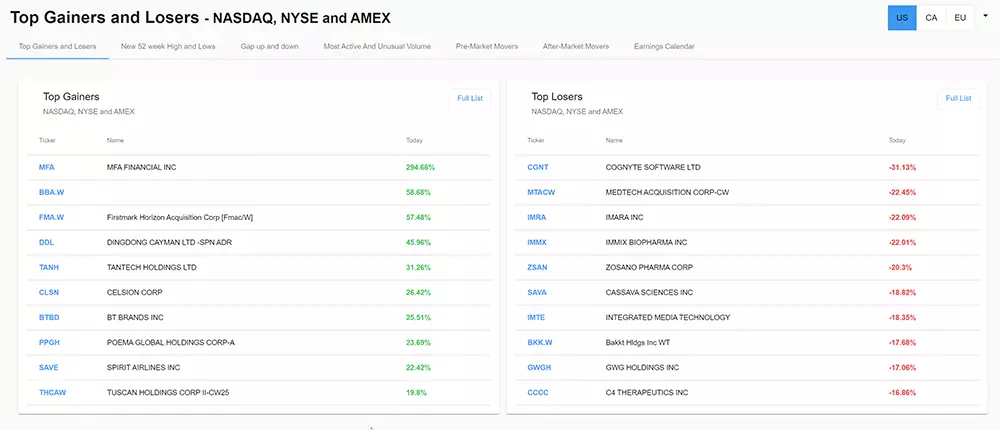
For the basic screen, US stocks are retained with a minimum volume of 100,000. The results are then ranked from best to worst performing in a table. To see the charts change the view to 'charts'.
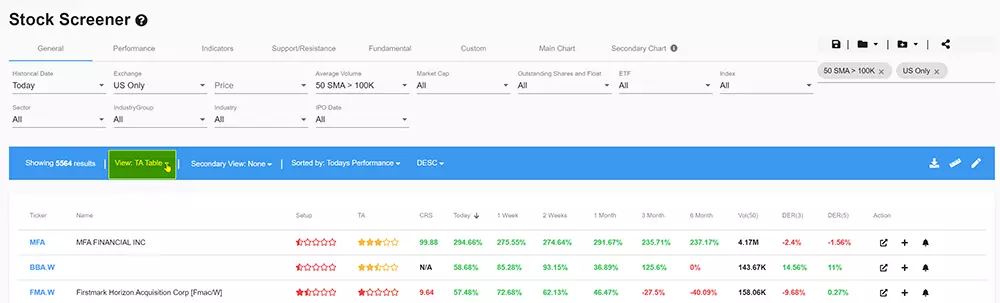
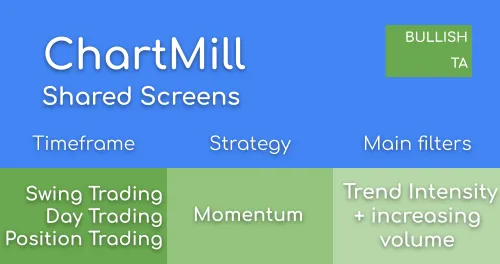
The first thing to notice is that the screen does not take into account the general trend in which a stock is located. In this case I only want shares that show an upward trend. To modify this, there are several ways but the easiest is to open the 'ChartMill Trend' section via the 'indicators' tab and to select the options 'short term positive' and 'long term positive'. This ensures that we only keep stocks that are in a clear upward trend.
If you prefer to use the SMA200 to determine the trend, this is also possible via the 'Performance' tab and the 'Price versus SMA' section where you can determine whether the price should be above or below the SMA200. If you want a rising SMA200 you can also set that via the 'SMA200' section.
With many of the results you will notice that the stock has already had a very strong upward movement. That is not really what we are looking for. The ChartMill Setup rating filter is ideal for filtering out such setups.
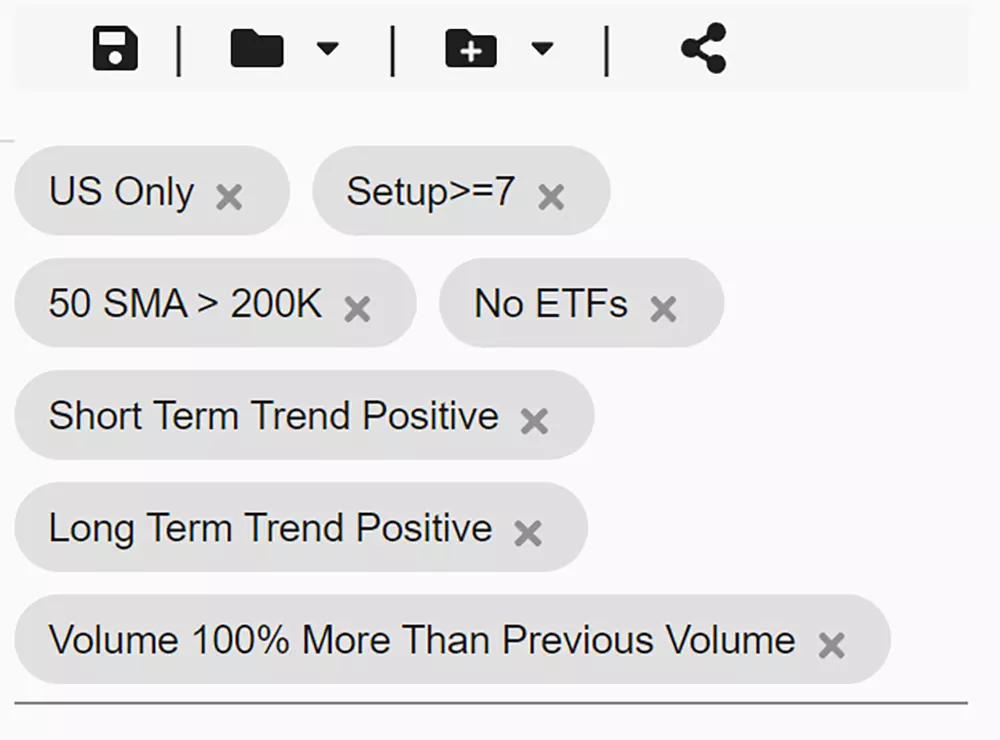
To do this, go to the indicators tab and in the section 'chartmill setup rating' set a score of 7/10. The stocks that remain are a lot more interesting because they tend to move sideways in a positive main trend.
As with the 52-week high momentum screen, I now proceed with the volume filter. Stay in the 'indicators' tab and via the 'volume increase' section set the volume requirement to be at least 100% higher than the volume of the previous trading day.
The final screen:
Pre-market Movers
The pre-market screen filter is perhaps the most interesting filter for those trading primarily intraday.
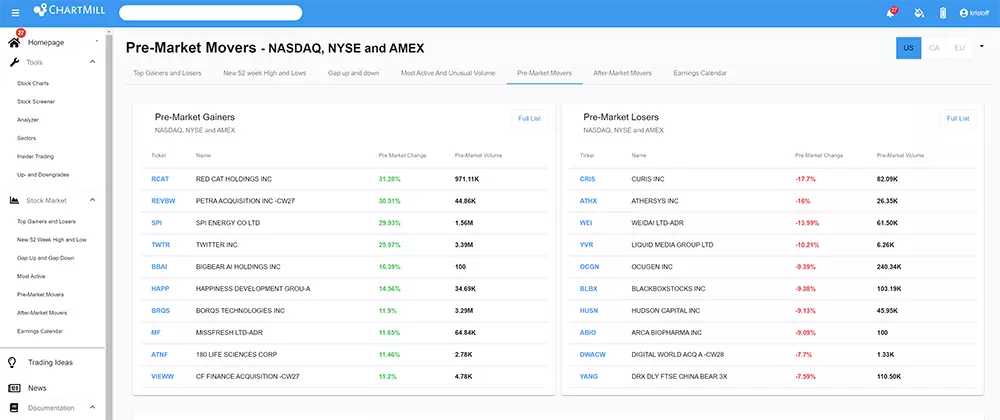
Click on the "full list" button and you will see all the results in the screener via the "extended hours" table.
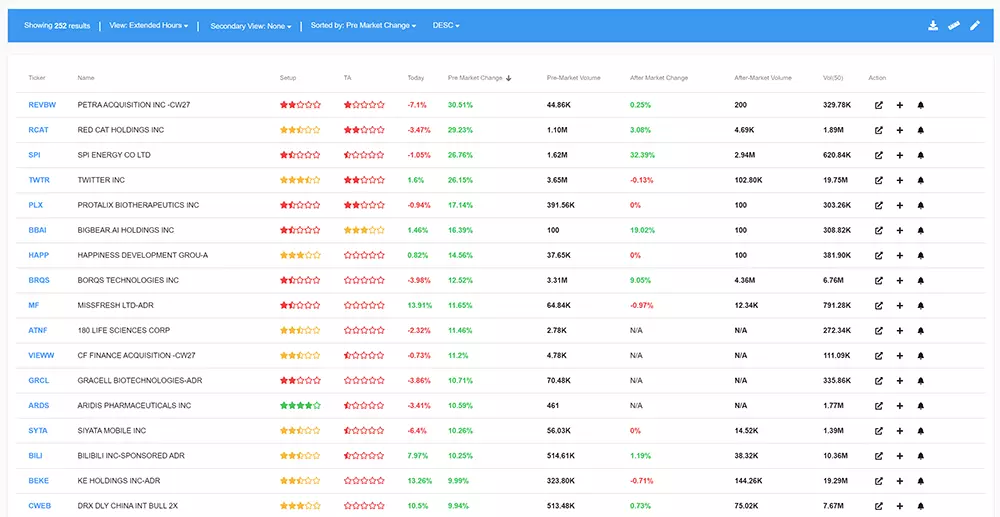
The results are arranged by 'pre market change'. Be sure to check the 'pre-Market volume' and compare it to the 'Vol (50)' column which shows the average volume of the last 50 trading days.
Below as an example the Twitter stock which is up over 25% pre-market.
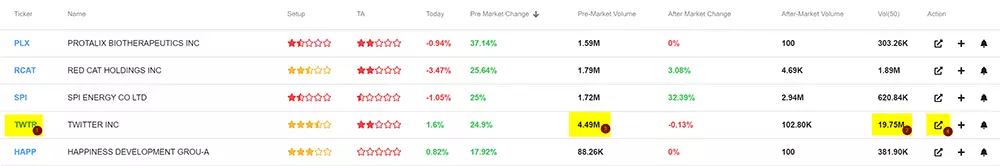
To find out the reason for this strong demand and rise, in many cases you will find the answer by opening the ticker's full profile and consulting its most recent news. To do this, click once on the arrow icon under the 'action' column (see image above).
In the next screen, via the 'News' tab, you can quickly find out the possible reason behind the stock's rise.
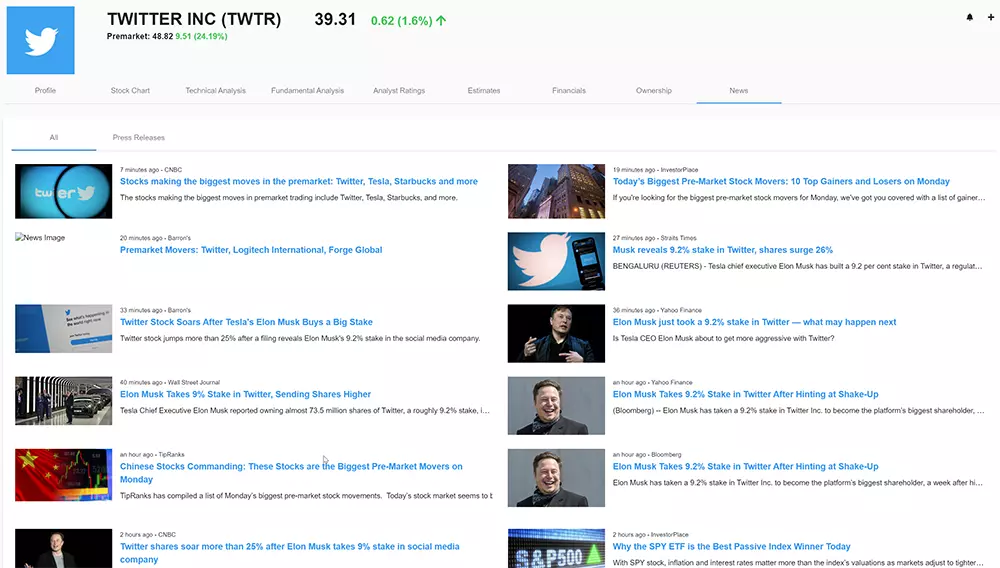
In this case, it's abundantly clear... Less than an hour ago (at the time of writing this article, 2022/04/04 before market opens), it became public that Elon Musk is taking a stake in Twitter of more than 9%. Such big names with such pre-market activity is invaluable to daytraders who wish to capitalize on momentum.
As with the other screens, you can further customize the results by changing filters or adding additional filters.
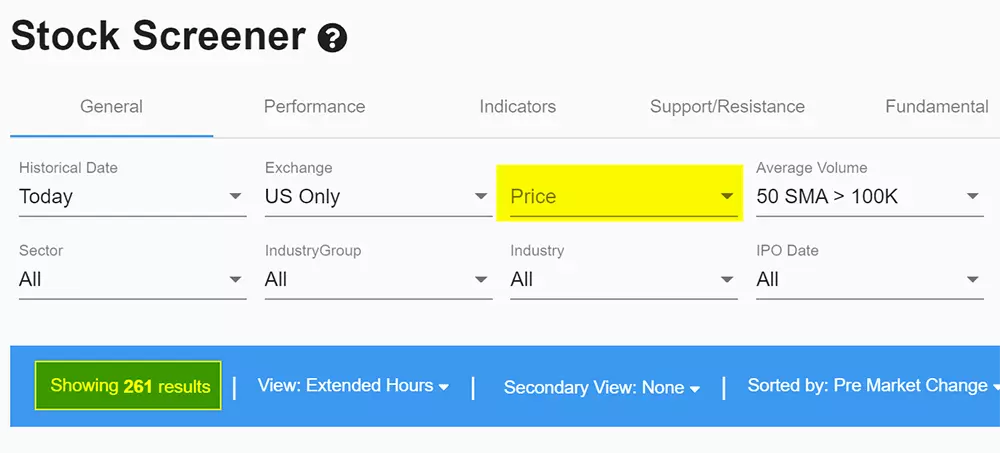
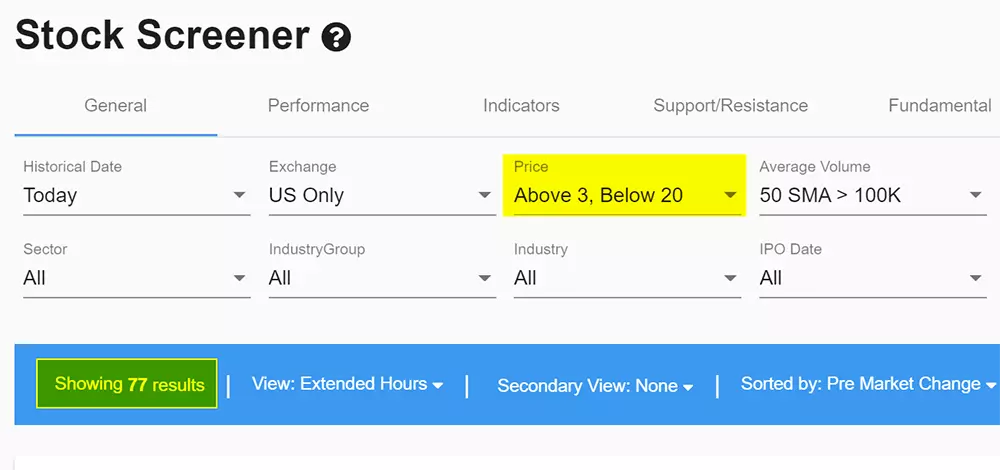
For example, many daytraders will avoid stocks that are priced too high. This can be easily adjusted in ChartMill via the 'General' menu. Via the 'price' section, you can easily set a maximum price for the stocks. As an example, I'll take a price range of minimum $3 and maximum $20. This reduces the number of results from 261 to only 77.
Quarterly results today and tomorrow (Earnings calender)
Perhaps not so obvious to use as a momentum screen but definitely worth a rapid check daily. I explain why below. First click on the item 'earnings calender' in the left main menu after which you will view this page:
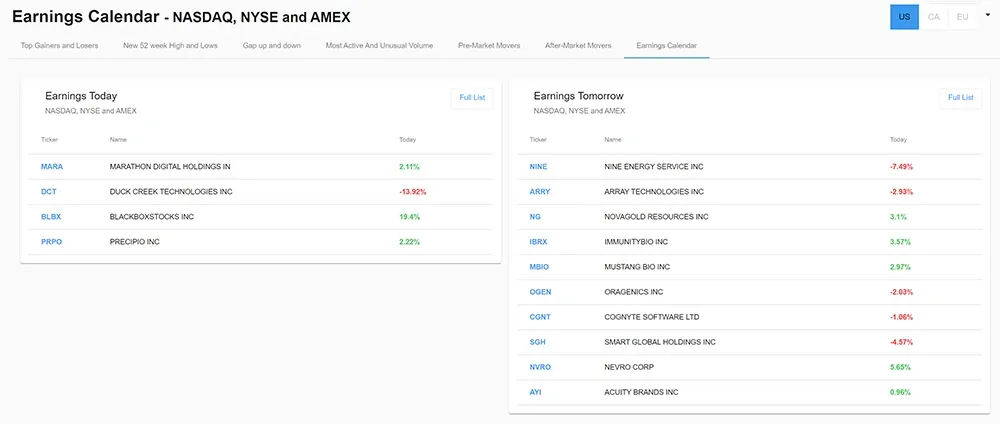
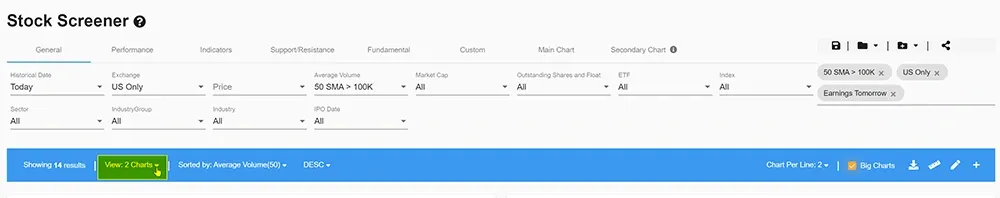
On the left you can find the stocks that announce their quarterly results on the day itself, on the right the stocks for which this happens on the next trading day. In this case I choose to open the complete list of stocks that announce their results the next day. Make sure you have set the view to 'two charts', that way you can compare the daily chart with the weekly chart.
Since we know that for these stocks important news will be announced tomorrow it is interesting to see what price action is currently developing on the daily and weekly chart.
Especially those stocks whose volume has increased (strongly) before the actual announcement of the results or where the price is about to break out of a specific range are interesting to follow up further.
On the date I am writing this article (monday 2022-04-04 before market open) there are 14 stocks that will announce results on 2022-04-05. One of them is AYI (earnings announcement before market open). Below the weekly and daily chart from friday 2022-04-01:
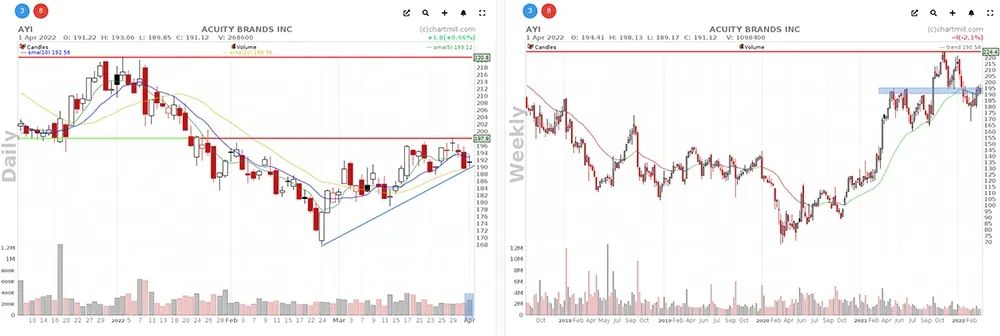
On the right the weekly chart, AYI is at a crucial price level and is trying to recapture the previously lost support around the $195 price level. On the daily chart on the left, there is the formation of an ascending triangle pattern. Last Friday, April 01 an inside candle was formed with slightly higher volume than the previous days. The narrow daily range indicates the uncertainty of what is yet to come and the fact that buyers and sellers are balancing each other - at least for now. Both the horizontal resistance line and the ascending blue trend line are the main levels to take into account. After all, you cannot predict quarterly results and certainly not the reaction to those results!
The point is that if there is a positive reaction to the results, a break-out above the existing horizontal red line on the daily chart could be an ideal entry moment to profit from the price reaction and the related momentum. The opposite scenario occurs when there is a clear drop below the rising trend line. This can happen before, during or after the results are announced.
How this will turn out we will find out in the coming days, you can check the current chart of the stock right here > Chart AYI.
By checking stocks that release important news in the coming days with a high probability of an increase in volatility and accompanying momentum, you can develop specific "what if" strategies that allow you to benefit from significant price movements.
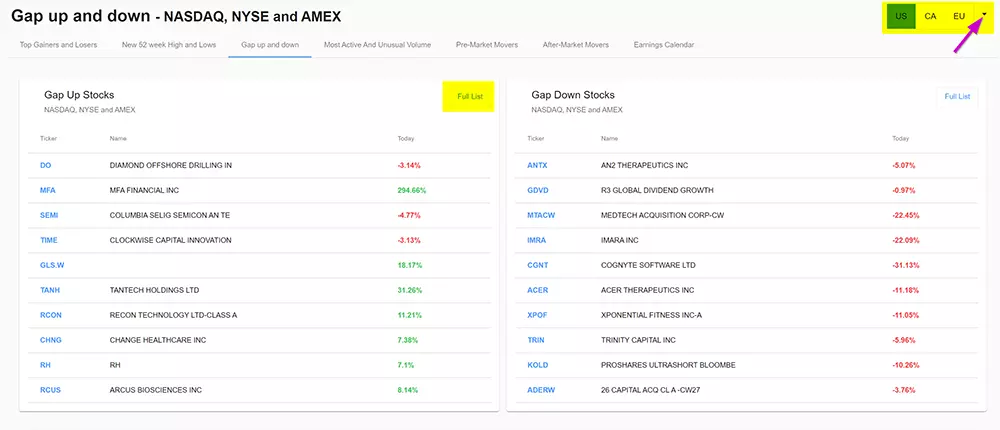
Gap Up and Gap Down
Gaps are very popular among momentum traders because the movement is usually accompanied by strong volume anyway. After all, there must be a reason that the price suddenly opens higher. This may be because good news was released for the specific stock or the sector or industry to which the stock belongs.
The section 'Gap Up and Gap Down' in the left main menu under the tab 'Market overview' brings you to a page where you get a handy overview of stocks that show a standard gap of at least 2%. Region and volume are by default set to 'US' and '100,000' but both those basic filters can easily be adjusted in the top right corner of the page.
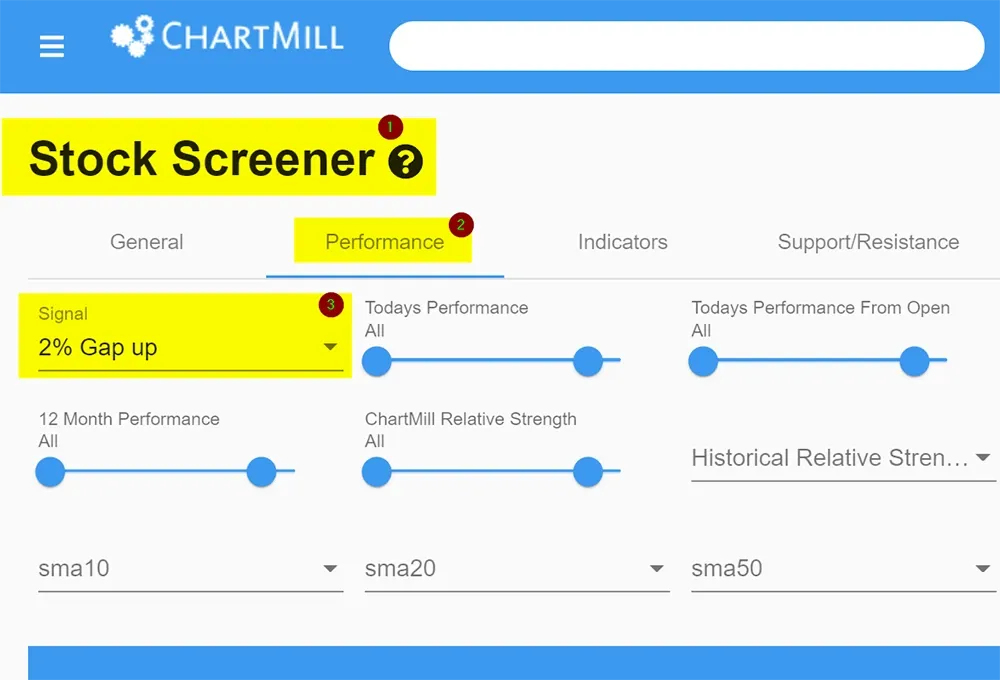
Click on 'Full List' to go to the stock screener where you can apply additional filters.
By default you get to see all gaps of at least 2%. Of course you can adjust this value. You can do so via the 'performance' tab in the 'Signal' section where you can choose between a 2% or 4% gap.
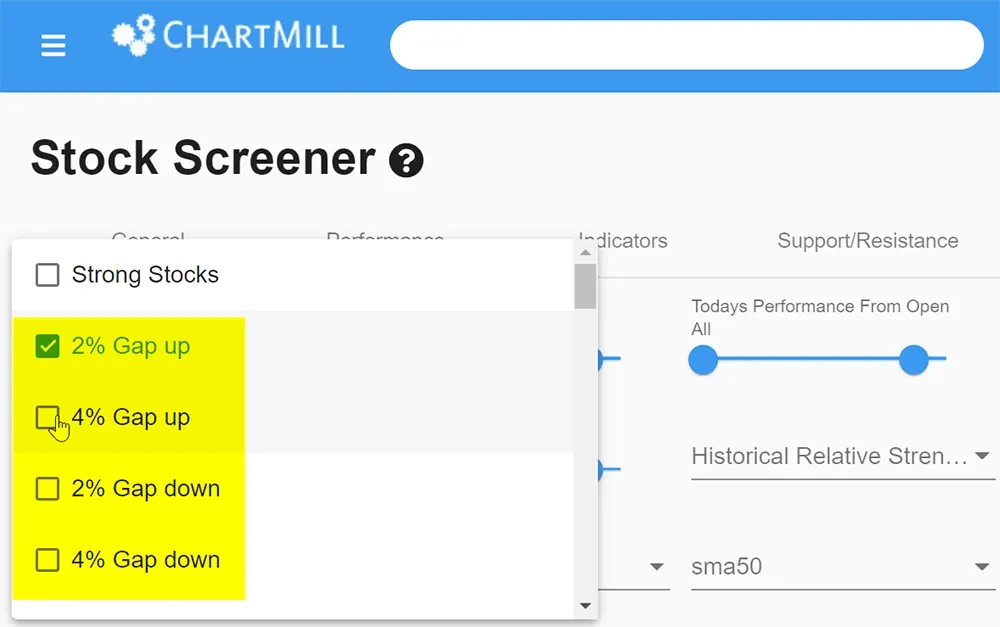
It is also possible through a custom expressions where you can choose any percentage you want (see the video).
In addition to the size of the initial gap, you can also define the maximum increase. By default there is no limit. If, for example, you want to exclude all shares that have already risen more than 20% you can do so via the 'performance' tab.

Gap trading can be done in different ways. In this article you will learn about a number of different gap strategies.
In summary
In this article, we've highlighted a few momentum screens. But after reading this post, you will probably have noticed for yourself that the possibilities are endless. One constant that always comes back with momentum strategies is rising volume. Something to remember!
Also keep in mind that a specific momentum screen which works very well today, might hardly produce any candidates as of tomorrow. This is not unusual, quite the contrary! Market conditions are constantly changing, especially in volatile times like today. So create multiple screens that start from a different angle. Moreover, you can also make several variants of one screen by adjusting the value of one individual filter (stricter, less strict).