Piotroski F-score Stock Screener
By Kristoff De Turck - reviewed by Aldwin Keppens
Last update: Apr 28, 2023
Introduction
What exactly the Piotroski F-score is, what the valuation criteria are and how you can interpret the results can be read in this article, Piotrosky F-score explained.
Calculating the F-score manually is certainly possible, all the necessary information is present in the financial figures that companies release every year. However, it is a very time-consuming activity and the risk of errors is always present. Fortunately, you don't have to calculate the score yourself. The Piotroski F-score is present in our stock screener by default under the fundamental filter menu.
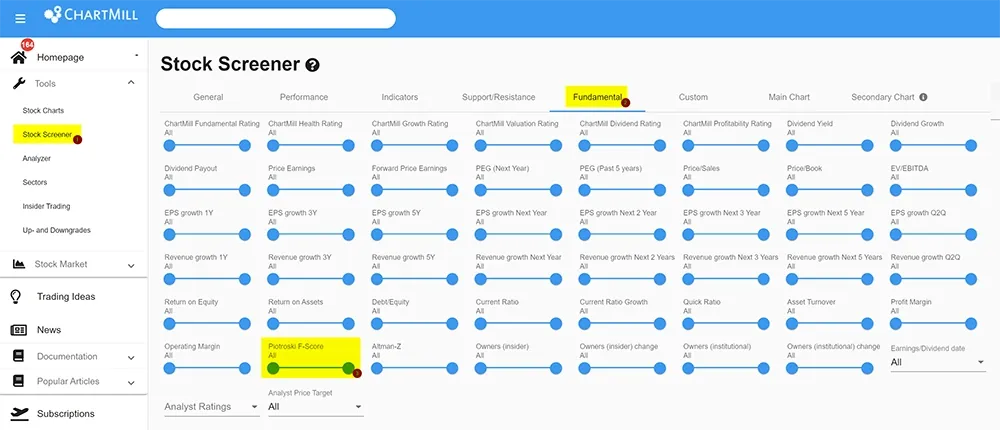
This Piotroski screen shows all US stocks with following standard filters:
- minimum price of $5,
- average trading volume of at least 500,000
- Market capitalization >= 300M
Additional specific filters:
- ChartMill Valuation rating 6/10 or higher
- P/B maximum 2
- Piotroski F-score 8 or higher
Since it turned out that the formula also works without the low P/B condition, we eliminated that ratio in this modified Piotroski screen. This significantly increases the number of candidates. Omitting this P/B filter is our preference anyway because it is best to compare this ratio at the sector or industry level rather than entering a constant value as an upper limit. You can still view the P/B ratio between the companies within the same sector or industry based on the results.
The results are best shown via the 'FA table' view.
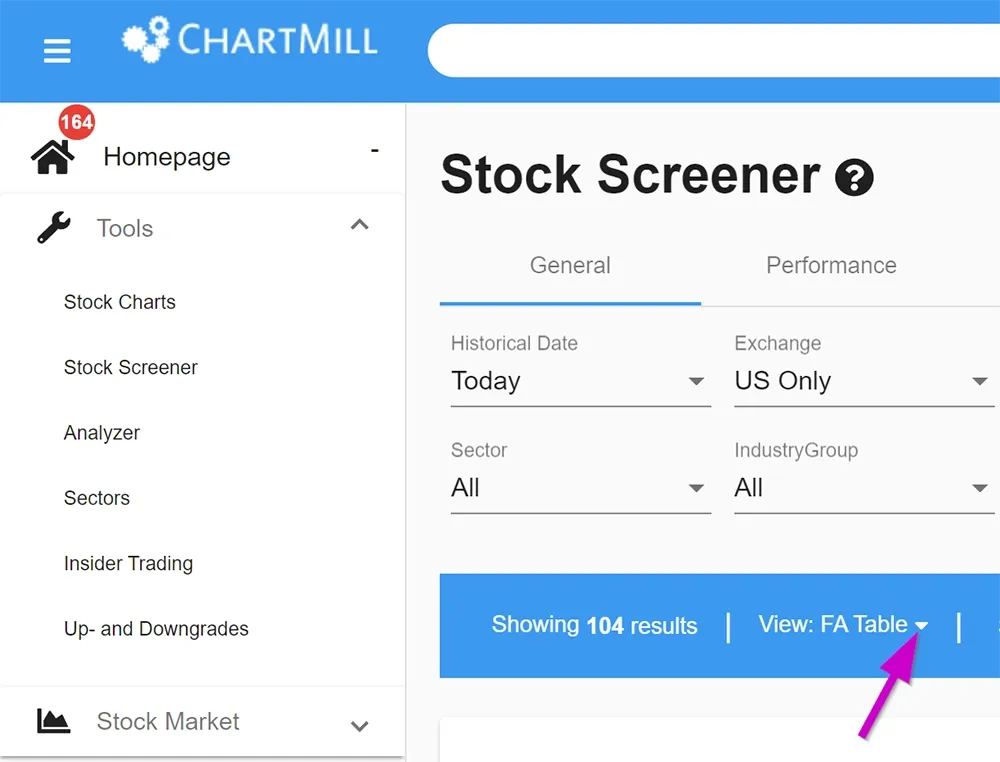
To do so, click on the inverted triangle next to 'View' in the blue horizontal bar and select 'FA table'. In the standard FA-table view the P/B ratio is not included. However, you will see it if you change the view to 'Fundamental'.
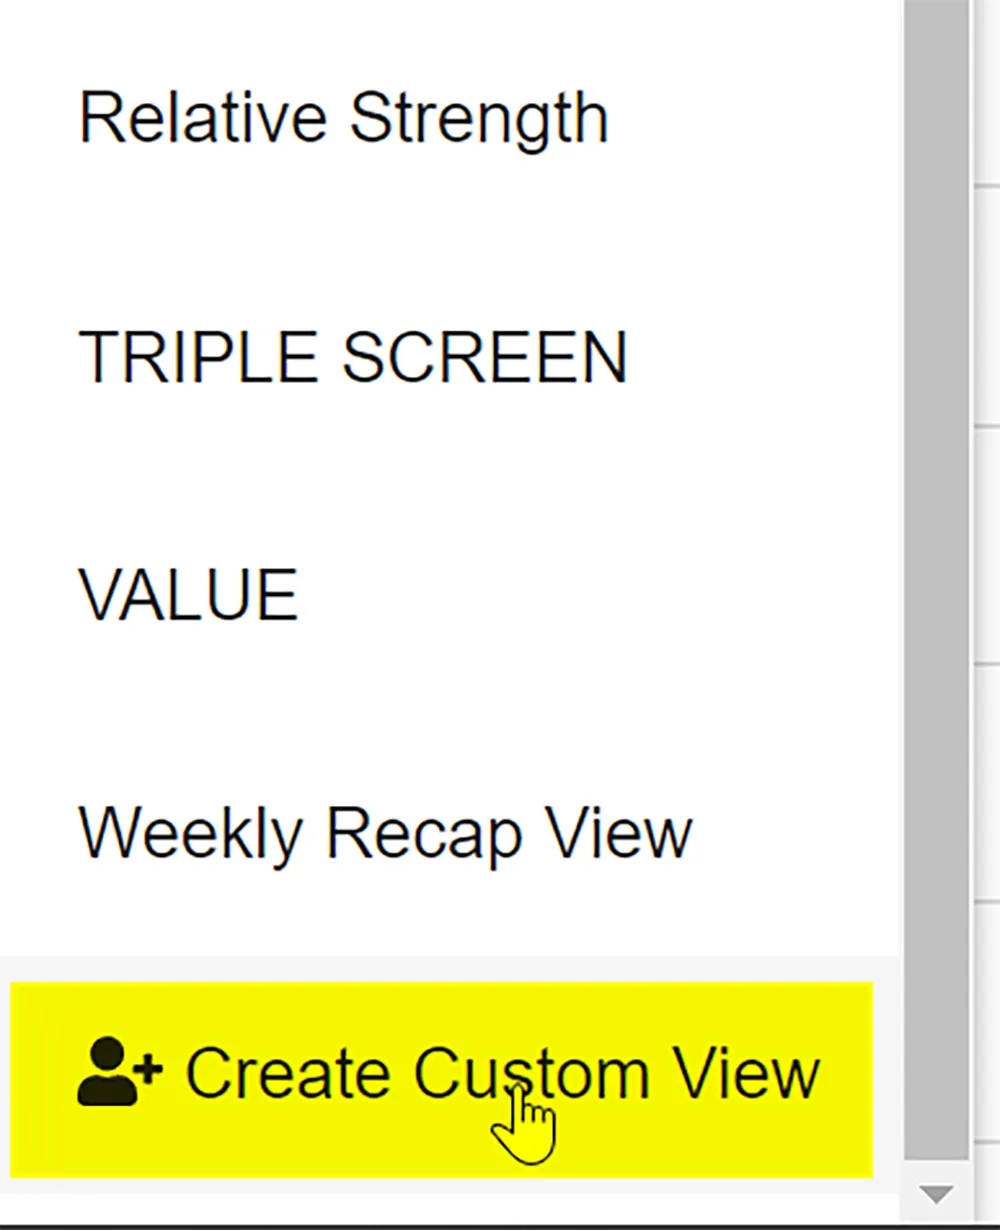
Would you like to create your own customized table with the parameters that are important to you? That is also possible, click again on the inverted triangle. In the drop down menu, scroll all the way down to select 'Create Custom View'.
From here you can create a completely new table. An example of how to create a custom table view can be found in this video about screening value stocks (starts at 06:01).
If you want to view the results by sector or industry, you can select them individually via the 'general tab' in the stock screener.
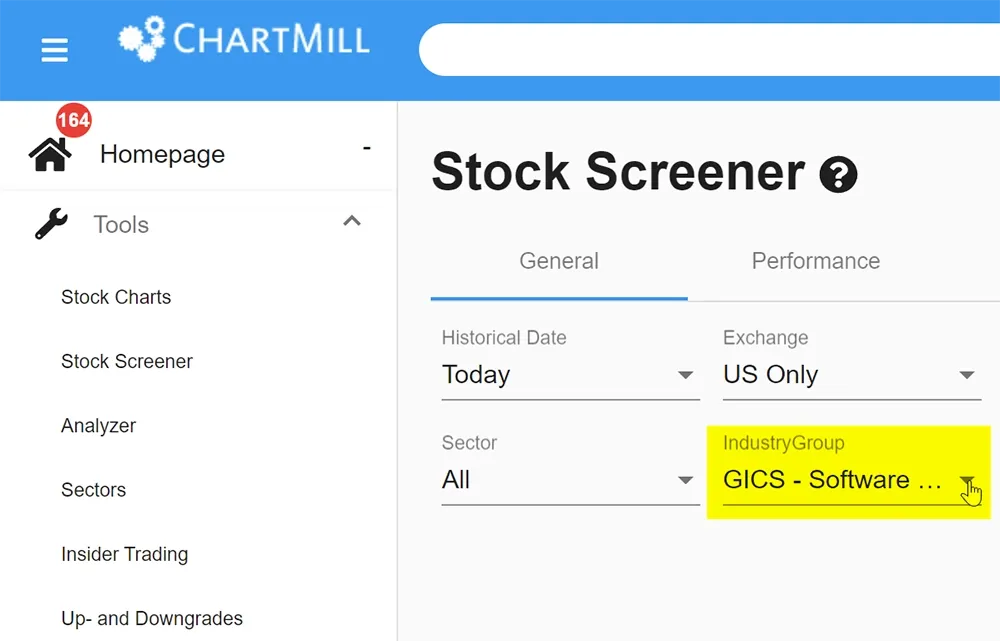
In the following screen we have selected only the US stocks that belong to the industry group 'Software and Services'.
As a final example, a modified Piotroski F-screen which searches for European stocks using the following basic filters:
- minimum price of €5,
- Average trading volume of at least 100,000
- Market capitalization >= 300M
Additional specific filters:
- ChartMill Valuation rating 6/10 or higher
- Piotroski F-score 7 or higher
As you've probably noticed, the settings are somewhat less strictly defined in order to keep enough candidates.
Adding technical filters?
The neat thing about ChartMill is that you can easily combine fundamental and technical filters without any limit.
Here are some examples to get you started:
- European stocks with a Piotroski F-score of at least 7 and whose price is close to the highest 52-week price.
- Canadian stocks with a Piotroski F-score of at least 7 and whose short-term trend is downward.
- US stocks with a Piotroski F-score of at least 8 and whose Slow Stochastics indicator crosses the 30 level upwards.
Obviously, there are plenty of other combinations to choose from, so be sure to test them out and find out what your favorites are. Good luck!