Fundamental Valuation Filters
By Kristoff De Turck - reviewed by Aldwin Keppens
Last update: Mar 8, 2024
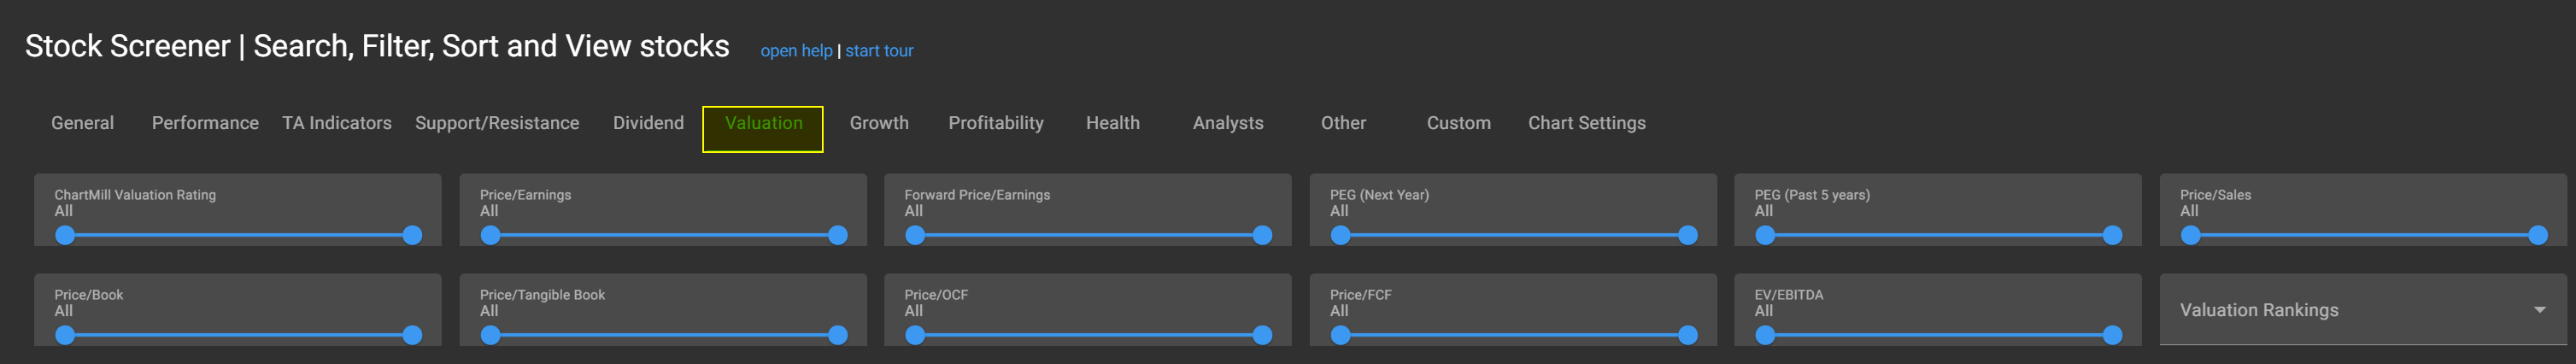
In this article we will discuss the fundamental filters related to the valuation of a stock. All these filters are available in our stock screener and can be found under the Valuation tab.
Price Earnings
The Price/Earnings ratio says something about the valuation of the company and its profit forecast. In order to calculate a price-to-earnings ratio, the company must make a profit. The calculation is simple, the share price is divided by earnings per share. In general, the higher the price-to-earnings ratio, the more expensive the company is considered (appreciation). A low p/e is an indication that a company is undervalued, while a high p/e points in the direction of an overvaluation. Yet this is a (too) gross generalization. A high p/e can also be interpreted as if a company expects a larger increase in profits in the future while at a low p/e a decrease of the same profits will occur (profits forecast).
The table below can be used as a guideline in interpreting these ratios. However, keep in mind that these are only average guiding values!
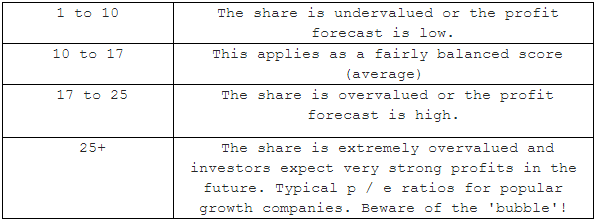
Comparing price / earnings ratios is only useful between companies that are part of the same sector. Indeed, certain sectors are characterized by low p/e while other sectors have higher p/e.
Forward Price Earnings
The only difference with the explanation above about the normal price-to-earnings ratio is the way in which it is calculated. For the normal p/e, the share price is divided by the known earnings per share. However, for the calculation of the future p/e, analysts use a future 'earnings per share' based on an estimate of the 'expected profit'. This calculation may be more up-to-date, but of course with less certainty (estimates may differ a lot).
Read more detailed information about the Price/Earnings ratio.
PEG-ratio - Price Earnings Growth ratio
This ratio is a combination of the previously mentioned price/earnings ratio but adds a further factor, which is the expected future growth. The ratio thus consists of three combined elements. The PEG-ratio itself can be calculated by dividing the p/e by the percentage of expected growth.
In the stock screener itself there are two ways to calculate the PEG-ratio. You can filter on the PEG-ratio, which calculates the growth factor based on the estimated profit for the coming year. Or you can use the PEG-ratio, which calculates the growth expectancy based on the profit achieved over the last 5 years (average).
The value obtained is the so-called PEG-ratio.
Finally, an example of the application of the PEG-ratio: We assume two companies;
Company A has a price/earnings ratio of 16 and a predicted annual growth rate of 20%. Company B has a p/e ratio of 12 and a projected annual growth rate of 12%. Based solely on the p/e data, company B seems to be a more interesting option considering the lower p/e.
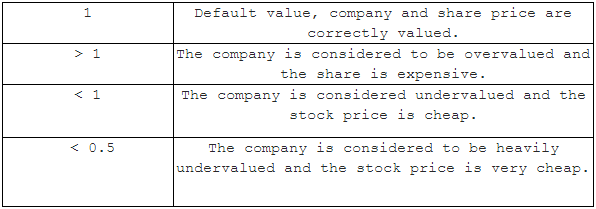
However, if we calculate the PEG-ratio for both companies, the conclusion is different. For company A this is 16/20 (p/e divided by annual expected growth) = 0.8. For company B we will get 1 (12/12).
If we compare these figures with the table above, it seems that company B is indeed valued correctly (PEG-ratio of 1) but company A - despite its significantly higher p/e - with a PEG- ratio of 0.8 is a better choice.
Read more detailed information about the PEG-ratio.
Price/Sales
Perhaps not as well known as the price / earnings ratio, but surely a ratio that has its value when it is used correctly.
The Price/Sales ratio is calculated by dividing the share price through revenue per share. By default, this ratio is calculated over the last 12 months. The ratio is therefore based on revenue and not on profit. After all, sales are less sensitive to "smart accounting" than the profit a company reports. The lower the price/sales ratio, the cheaper the company and the more interesting for investors.
Note that a high turnover does not automatically mean a company makes a lot of profits (the company can only have a very small profit margin). But it can lead to a strong improvement in profits if the company succeeds in boosting the profit margin with the same revenue.
Because revenue is used to calculate this ratio, this is a formula that is used primarily for companies that have no or very little operating profit. As with the price/earnings ratio, you should only use it to compare companies that are active in the same sector and/or industry because the profit margins per sector can vary considerably.
An example to finish: Company A has generated revenue of $ 1,000,000 in the last 12 months. There are a total of 200,000 outstanding shares and the price of the share amounts to 20$. The turnover per share is therefore 1,000,000 / 200,000 = 5 $. We then get the price / turnover by dividing the share price (20) by revenue per share (5).
Read more detailed information about the Price/Sales ratio.
Price/Book
Another 'Value' ratio in our stockscreener is the Price/Book ratio. This is obtained by dividing the price of the share by the company's book value (based on the last quarter). The book value consists of the total assets of a company (buildings, machinery, stocks, etc.) minus all the debts that the company has. A low book value (as compared to sector partners) is therefore an indication that the company is "cheap".
However, be careful with a low book value (<1), which means that the shareholders want to pay less than the residual value of the company based on its assets. Either the company is really a bargain or there is fundamentally something wrong (bad prospects for example).
Read more detailed information about the Price/Book ratio.
Price/Free and Operating Cash Flow (Price/FCF & Price/OCF)
The Price to Free Cash Flow ratio is a valuation metric that compares a company's market price per share to its free cash flow per share. Free cash flow represents the cash generated by a company after accounting for its operating expenses, capital expenditures, and taxes.
The Price to operating cash flow compares a company's price to its operating cash flow. To do this, a company's market capitalization is divided by its operating cash flow.
More information about both of these ratios can be found in this and this article.
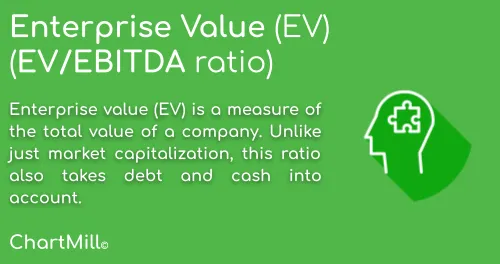
EV/EBITDA-ratio
This is a useful ratio when comparing companies that have different levels of debt and present value, two aspects that enterprise value takes due account of, unlike some other valuation ratios. All short-term and long-term debt as well as all cash and cash equivalents are included in the calculation.
Read more detailed information about the EV/EBITDA ratio.
Related Articles
Fundamental Growth Filters
In this article we will discuss all the available fundamental filters related to the Growth of a stock. Read more...
Fundamental Profitability Filters
In this article we will discuss all the available fundamental filters related to the Profitability of a stock. Read more...
Fundamental Health Filters
In this article we will discuss all the available fundamental filters related to the Financial Health of a stock. Read more...
Fundamental Dividend Filters
In this article we will discuss all the available fundamental filters related to the Dividend of a stock. Read more...